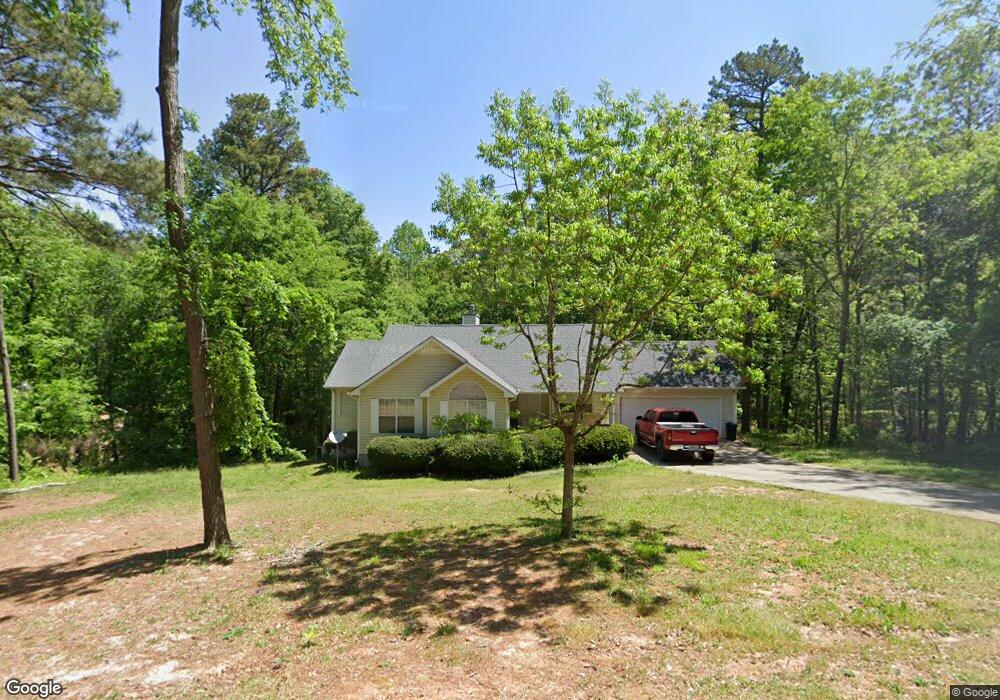
411 Busby Ln Winder, GA 30680
Estimated Value: $286,000 - $297,789
--
Bed
2
Baths
1,278
Sq Ft
$229/Sq Ft
Est. Value
About This Home
This home is located at 411 Busby Ln, Winder, GA 30680 and is currently estimated at $292,197, approximately $228 per square foot. 411 Busby Ln is a home located in Barrow County with nearby schools including Holsenbeck Elementary School, Bear Creek Middle School, and Winder-Barrow High School.
Ownership History
Date
Name
Owned For
Owner Type
Purchase Details
Closed on
Jan 19, 2007
Sold by
Darby Daniel D
Bought by
Dunahoo Richard M
Current Estimated Value
Home Financials for this Owner
Home Financials are based on the most recent Mortgage that was taken out on this home.
Original Mortgage
$108,900
Outstanding Balance
$64,606
Interest Rate
6.08%
Mortgage Type
New Conventional
Estimated Equity
$227,591
Purchase Details
Closed on
Mar 24, 2000
Sold by
Crane Raymond J
Bought by
Darby Daniel D
Home Financials for this Owner
Home Financials are based on the most recent Mortgage that was taken out on this home.
Original Mortgage
$83,215
Interest Rate
8.37%
Mortgage Type
New Conventional
Purchase Details
Closed on
Jun 23, 1998
Sold by
Dorch Janet 55% Int
Bought by
Jug Tavern Enterpris
Purchase Details
Closed on
Mar 10, 1997
Sold by
Dorch Janet 55% Int
Bought by
Dorch Janet 55% Int
Purchase Details
Closed on
Apr 2, 1990
Sold by
Gaston Acres
Bought by
Dorch Janet 55% Int
Create a Home Valuation Report for This Property
The Home Valuation Report is an in-depth analysis detailing your home's value as well as a comparison with similar homes in the area
Home Values in the Area
Average Home Value in this Area
Purchase History
| Date | Buyer | Sale Price | Title Company |
|---|---|---|---|
| Dunahoo Richard M | $121,000 | -- | |
| Darby Daniel D | $97,900 | -- | |
| Jug Tavern Enterpris | -- | -- | |
| Dorch Janet 55% Int | -- | -- | |
| Dorch Janet 55% Int | -- | -- |
Source: Public Records
Mortgage History
| Date | Status | Borrower | Loan Amount |
|---|---|---|---|
| Open | Dunahoo Richard M | $108,900 | |
| Previous Owner | Darby Daniel D | $83,215 |
Source: Public Records
Tax History Compared to Growth
Tax History
| Year | Tax Paid | Tax Assessment Tax Assessment Total Assessment is a certain percentage of the fair market value that is determined by local assessors to be the total taxable value of land and additions on the property. | Land | Improvement |
|---|---|---|---|---|
| 2024 | $2,112 | $88,399 | $26,000 | $62,399 |
| 2023 | $1,498 | $80,399 | $18,000 | $62,399 |
| 2022 | $1,854 | $67,771 | $18,000 | $49,771 |
| 2021 | $1,650 | $57,600 | $14,000 | $43,600 |
| 2020 | $1,315 | $46,342 | $12,000 | $34,342 |
| 2019 | $1,337 | $46,342 | $12,000 | $34,342 |
| 2018 | $1,315 | $46,342 | $12,000 | $34,342 |
| 2017 | $1,148 | $39,434 | $10,200 | $29,234 |
| 2016 | $982 | $36,318 | $9,400 | $26,918 |
| 2015 | $996 | $36,622 | $9,400 | $27,222 |
| 2014 | $867 | $32,318 | $5,096 | $27,222 |
| 2013 | -- | $31,007 | $5,096 | $25,911 |
Source: Public Records
Map
Nearby Homes
- 0 Busby Ln Unit 7159845
- 0 Busby Ln Unit 7024907
- 0 Busby Ln Unit 8073092
- 415 Busby Ln
- 412 Busby Ln
- 416 White Way
- 410 White Way
- 414 Busby Ln
- 417 Busby Ln
- 374 Ashton Way
- 416 Busby Ln
- 408 White Way
- 0 White Way Unit CM910558
- 0 White Way Unit 8699831
- 0 White Way Unit 3138035
- 0 White Way Unit 7250106
- 0 White Way Unit 7269052
- 372 Ashton Way Unit 2/74
- 372 Ashton Way
- 372 Ashton Way Unit 74