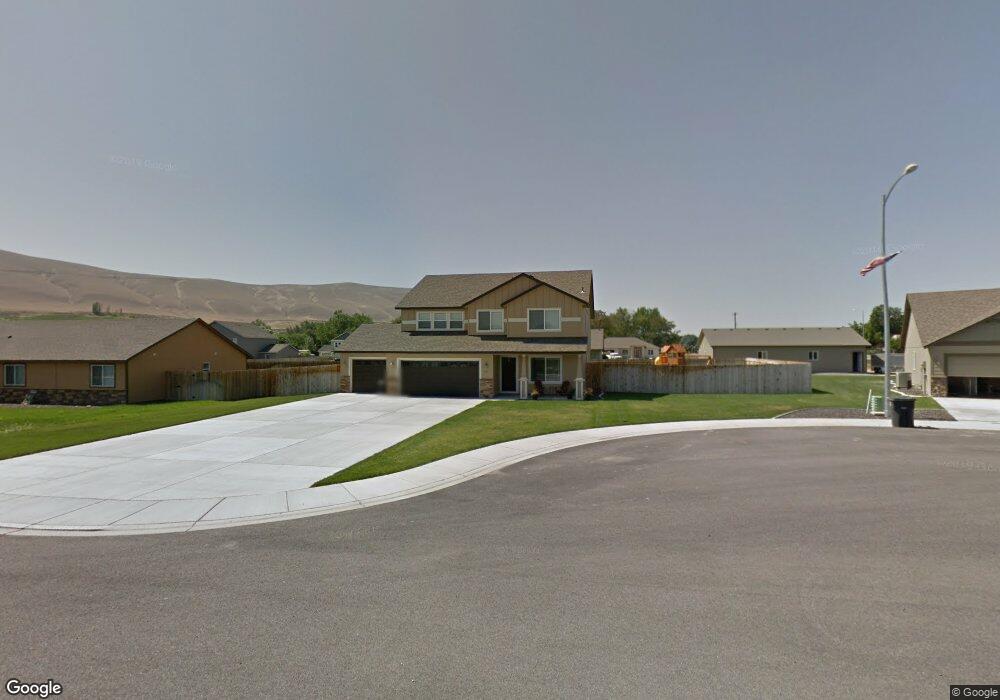
411 Capri Ct Unit Reduced $10,000! 0 D Benton City, WA 99320
Estimated Value: $467,000 - $510,000
3
Beds
3
Baths
2,085
Sq Ft
$236/Sq Ft
Est. Value
About This Home
This home is located at 411 Capri Ct Unit Reduced $10,000! 0 D, Benton City, WA 99320 and is currently estimated at $492,187, approximately $236 per square foot. 411 Capri Ct Unit Reduced $10,000! 0 D is a home located in Benton County with nearby schools including Kiona-Benton City Primary School, Kiona-Benton City Middle School, and Kiona-Benton City High School.
Ownership History
Date
Name
Owned For
Owner Type
Purchase Details
Closed on
Apr 11, 2014
Sold by
Privratsky Ryan N and Privratsky Casey R
Bought by
Coker Lesley Anne
Current Estimated Value
Home Financials for this Owner
Home Financials are based on the most recent Mortgage that was taken out on this home.
Original Mortgage
$225,735
Outstanding Balance
$171,988
Interest Rate
4.4%
Mortgage Type
FHA
Estimated Equity
$320,199
Purchase Details
Closed on
Dec 14, 2011
Sold by
Alderbrook Homes Llc
Bought by
Privratsky Ryan N and Privratsky Casey R
Home Financials for this Owner
Home Financials are based on the most recent Mortgage that was taken out on this home.
Original Mortgage
$220,816
Interest Rate
3.94%
Mortgage Type
New Conventional
Purchase Details
Closed on
Apr 13, 2011
Sold by
Nsb Inc
Bought by
Alderbrook Homes Llc
Home Financials for this Owner
Home Financials are based on the most recent Mortgage that was taken out on this home.
Original Mortgage
$176,720
Interest Rate
4.83%
Mortgage Type
Construction
Purchase Details
Closed on
Oct 27, 2010
Sold by
Johnson Sandy and Vermeire Lynn
Bought by
Nsb Inc
Create a Home Valuation Report for This Property
The Home Valuation Report is an in-depth analysis detailing your home's value as well as a comparison with similar homes in the area
Home Values in the Area
Average Home Value in this Area
Purchase History
| Date | Buyer | Sale Price | Title Company |
|---|---|---|---|
| Coker Lesley Anne | $229,900 | Stewart Title Co 1 | |
| Privratsky Ryan N | $185,726 | Cascade Title | |
| Alderbrook Homes Llc | $19,919 | Cascade Title | |
| Nsb Inc | -- | Benton Franklin Title Co |
Source: Public Records
Mortgage History
| Date | Status | Borrower | Loan Amount |
|---|---|---|---|
| Open | Coker Lesley Anne | $225,735 | |
| Previous Owner | Privratsky Ryan N | $220,816 | |
| Previous Owner | Alderbrook Homes Llc | $176,720 |
Source: Public Records
Tax History Compared to Growth
Tax History
| Year | Tax Paid | Tax Assessment Tax Assessment Total Assessment is a certain percentage of the fair market value that is determined by local assessors to be the total taxable value of land and additions on the property. | Land | Improvement |
|---|---|---|---|---|
| 2024 | $3,515 | $455,450 | $90,000 | $365,450 |
| 2023 | $3,515 | $400,440 | $50,000 | $350,440 |
| 2022 | $3,286 | $326,660 | $50,000 | $276,660 |
| 2021 | $2,658 | $289,770 | $50,000 | $239,770 |
| 2020 | $3,241 | $262,110 | $50,000 | $212,110 |
| 2019 | $2,919 | $262,110 | $50,000 | $212,110 |
| 2018 | $3,301 | $243,660 | $50,000 | $193,660 |
| 2017 | $3,059 | $220,700 | $23,500 | $197,200 |
| 2016 | $3,237 | $220,700 | $23,500 | $197,200 |
| 2015 | $2,947 | $220,700 | $23,500 | $197,200 |
| 2014 | -- | $199,500 | $23,500 | $176,000 |
| 2013 | -- | $199,500 | $23,500 | $176,000 |
Source: Public Records
Map
Nearby Homes
- 1303 Babs Ave
- 501 Dozer Ct
- 805 Babs Ave
- 610 Botaka Loop
- 901 W 13th St
- NKA Kendall Rd
- 39304 N Olson Prairie NW
- 38906 N Demoss Rd
- 29904 N 113 Prairie NE
- 0 Lot 3 Block 7 Legion Heights #2 Unit 284583
- 2202 Rainy Ln
- 6616 NE 2nd St Unit Lot 4
- 6616 NE 2nd St Unit Lot 3
- 1213 12th St
- 9414 W Yakitat Place
- 1413 Jenna Ave
- 1415 Jenna Ave
- 1405 Jenna Ave
- 1417 Jenna Ave
- Whidbey Plan at Cherry Grove Lane