411 Chilson Ave Lansing, MI 48906
Creston NeighborhoodEstimated Value: $121,903 - $148,000
Studio
--
Bath
1,004
Sq Ft
$129/Sq Ft
Est. Value
About This Home
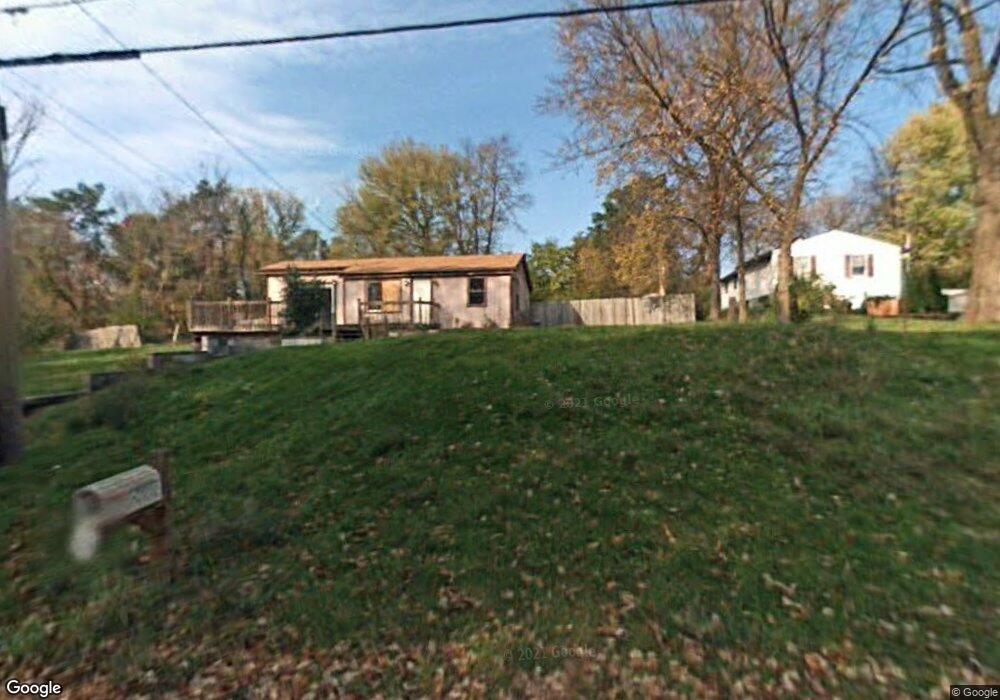
This home is located at 411 Chilson Ave, Lansing, MI 48906 and is currently estimated at $129,726, approximately $129 per square foot. 411 Chilson Ave is a home located in Ingham County with nearby schools including Gier Park School, Pattengill Academy, and Eastern High School.
Ownership History
Date
Name
Owned For
Owner Type
Purchase Details
Closed on
Sep 20, 2018
Sold by
Schertzing Eric A
Bought by
Mm Hotel Operating 56 Corp
Current Estimated Value
Purchase Details
Closed on
Oct 14, 2013
Sold by
Dysinger Bonnie K
Bought by
Aibout Fady
Purchase Details
Closed on
Nov 21, 2007
Sold by
Capital Community Cu
Bought by
Aibout Fady S
Home Financials for this Owner
Home Financials are based on the most recent Mortgage that was taken out on this home.
Original Mortgage
$28,700
Interest Rate
6.31%
Mortgage Type
Seller Take Back
Purchase Details
Closed on
Jan 18, 2007
Sold by
Gladstone Cynthia Sue
Bought by
Capital Community Cu
Purchase Details
Closed on
Aug 31, 2001
Sold by
Gladstone Jeffrey Lynn
Bought by
Gladstone Cynthia Sue
Home Financials for this Owner
Home Financials are based on the most recent Mortgage that was taken out on this home.
Original Mortgage
$68,000
Interest Rate
7.06%
Mortgage Type
Purchase Money Mortgage
Purchase Details
Closed on
Sep 1, 1992
Create a Home Valuation Report for This Property
The Home Valuation Report is an in-depth analysis detailing your home's value as well as a comparison with similar homes in the area
Home Values in the Area
Average Home Value in this Area
Purchase History
| Date | Buyer | Sale Price | Title Company |
|---|---|---|---|
| Mm Hotel Operating 56 Corp | $14,000 | None Available | |
| Aibout Fady | -- | None Available | |
| Aibout Fady S | $28,700 | None Available | |
| Capital Community Cu | $71,325 | None Available | |
| Gladstone Cynthia Sue | -- | Midstate Title Company | |
| -- | $15,000 | -- |
Source: Public Records
Mortgage History
| Date | Status | Borrower | Loan Amount |
|---|---|---|---|
| Previous Owner | Aibout Fady S | $28,700 | |
| Previous Owner | Gladstone Cynthia Sue | $68,000 |
Source: Public Records
Tax History
| Year | Tax Paid | Tax Assessment Tax Assessment Total Assessment is a certain percentage of the fair market value that is determined by local assessors to be the total taxable value of land and additions on the property. | Land | Improvement |
|---|---|---|---|---|
| 2025 | $2,865 | $62,800 | $21,900 | $40,900 |
| 2024 | $24 | $60,200 | $21,900 | $38,300 |
| 2023 | $2,696 | $56,000 | $21,900 | $34,100 |
| 2022 | $2,462 | $37,700 | $19,700 | $18,000 |
| 2021 | $2,405 | $33,500 | $15,000 | $18,500 |
| 2020 | $2,463 | $30,900 | $15,000 | $15,900 |
| 2019 | $2,418 | $28,800 | $15,000 | $13,800 |
| 2018 | $2,041 | $26,100 | $15,000 | $11,100 |
| 2017 | $3,384 | $26,100 | $15,000 | $11,100 |
| 2016 | $3,857 | $25,800 | $15,000 | $10,800 |
| 2015 | $3,857 | $25,300 | $0 | $0 |
| 2014 | $3,857 | $27,500 | $0 | $0 |
Source: Public Records
Map
Nearby Homes
- 2701 Creston Ave
- 213 E Thomas St
- 205 E Thomas St
- 2403 Turner St
- 816 Orchard Glen Ave
- 840 E Harris St
- 331 Douglas Ave
- 200 Mosley Ave
- 715 Randall St
- 310 W Frederick Ave
- 3425 Turner Rd
- 508 Filley St
- 504 W Fairfield Ave
- 2315 N High St
- 1919 N East St
- 2318 N High St
- 2112 N High St
- 627 W Frederick Ave
- 152 Donald Ave Unit 152
- 0 Lake Lansing Rd Unit 289258
- 415 Chilson Ave
- 339 Chilson Ave
- Chilson Ave
- 410 E Howe Ave
- 408 E Howe Ave
- 416 E Howe Ave
- 348 Chilson Ave
- 410 E How
- 422 E Howe Ave
- 319 Chilson Ave
- 423 Chilson Ave
- 356 Chilson Ave
- 428 E Howe Ave
- 430 E Howe Ave
- 429 Chilson Ave
- 400 Chilson Ave
- 317 Chilson Ave
- 2919 N Cedar St
- 440 E Howe Ave
- 409 E Howe Ave
Your Personal Tour Guide
Ask me questions while you tour the home.