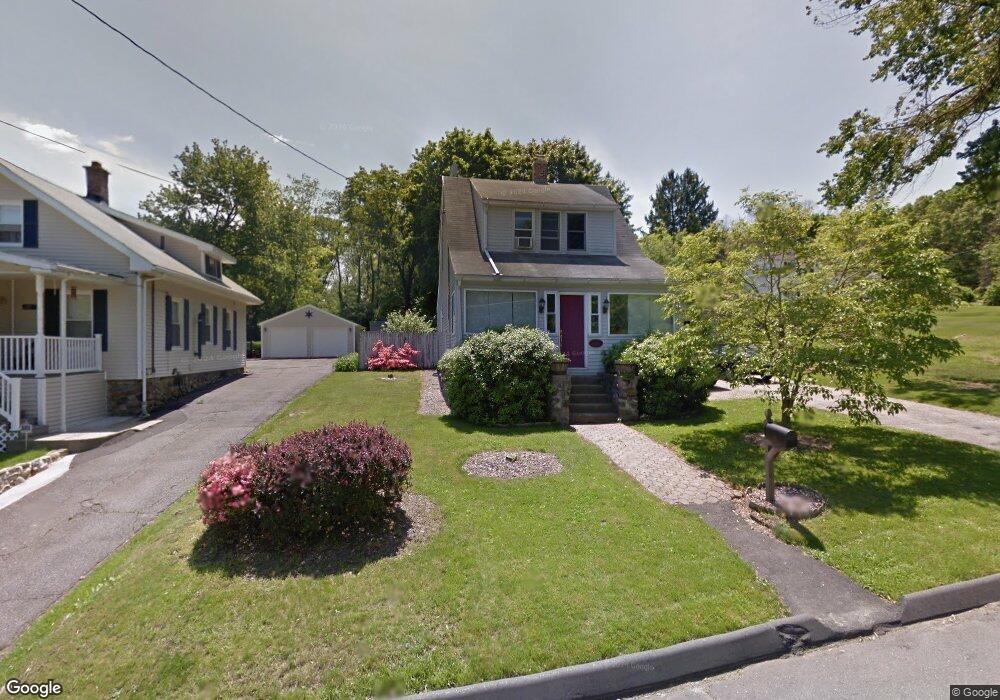
411 Chipman Street Extension Waterbury, CT 06708
West End District NeighborhoodEstimated Value: $264,000 - $302,000
2
Beds
2
Baths
1,074
Sq Ft
$268/Sq Ft
Est. Value
About This Home
This home is located at 411 Chipman Street Extension, Waterbury, CT 06708 and is currently estimated at $287,600, approximately $267 per square foot. 411 Chipman Street Extension is a home located in New Haven County with nearby schools including B.W. Tinker School, West Side Middle School, and John F. Kennedy High School.
Ownership History
Date
Name
Owned For
Owner Type
Purchase Details
Closed on
Mar 9, 2024
Sold by
Capozziello Lawrence A
Bought by
Capozziello Lawrence A and Capozziello Debra
Current Estimated Value
Home Financials for this Owner
Home Financials are based on the most recent Mortgage that was taken out on this home.
Original Mortgage
$225,000
Outstanding Balance
$221,258
Interest Rate
6.63%
Mortgage Type
Stand Alone Refi Refinance Of Original Loan
Estimated Equity
$66,342
Purchase Details
Closed on
Jun 4, 2001
Sold by
Krichbaum William G and Krichbaum Michelle H
Bought by
Capozziello L L and Capozziello Marilyn M
Purchase Details
Closed on
Jul 20, 1999
Sold by
Haydin Michael G and Haydin Lori A
Bought by
Skurat Michelle H
Purchase Details
Closed on
Aug 10, 1990
Sold by
Olson David P
Bought by
Haydin Michael G
Create a Home Valuation Report for This Property
The Home Valuation Report is an in-depth analysis detailing your home's value as well as a comparison with similar homes in the area
Home Values in the Area
Average Home Value in this Area
Purchase History
| Date | Buyer | Sale Price | Title Company |
|---|---|---|---|
| Capozziello Lawrence A | -- | None Available | |
| Capozziello Lawrence A | -- | None Available | |
| Capozziello L L | $104,900 | -- | |
| Skurat Michelle H | $95,000 | -- | |
| Capozziello L L | $104,900 | -- | |
| Skurat Michelle H | $95,000 | -- | |
| Haydin Michael G | $119,000 | -- |
Source: Public Records
Mortgage History
| Date | Status | Borrower | Loan Amount |
|---|---|---|---|
| Open | Capozziello Lawrence A | $225,000 | |
| Closed | Capozziello Lawrence A | $225,000 | |
| Previous Owner | Haydin Michael G | $106,708 | |
| Previous Owner | Haydin Michael G | $50,000 |
Source: Public Records
Tax History Compared to Growth
Tax History
| Year | Tax Paid | Tax Assessment Tax Assessment Total Assessment is a certain percentage of the fair market value that is determined by local assessors to be the total taxable value of land and additions on the property. | Land | Improvement |
|---|---|---|---|---|
| 2025 | $5,576 | $123,970 | $30,310 | $93,660 |
| 2024 | $6,129 | $123,970 | $30,310 | $93,660 |
| 2023 | $6,718 | $123,970 | $30,310 | $93,660 |
| 2022 | $4,684 | $77,800 | $30,290 | $47,510 |
| 2021 | $4,684 | $77,800 | $30,290 | $47,510 |
| 2020 | $4,684 | $77,800 | $30,290 | $47,510 |
| 2019 | $4,684 | $77,800 | $30,290 | $47,510 |
| 2018 | $4,684 | $77,800 | $30,290 | $47,510 |
| 2017 | $5,002 | $83,080 | $30,280 | $52,800 |
| 2016 | $5,002 | $83,080 | $30,280 | $52,800 |
| 2015 | $4,837 | $83,080 | $30,280 | $52,800 |
| 2014 | $4,837 | $83,080 | $30,280 | $52,800 |
Source: Public Records
Map
Nearby Homes
- 26 Oakleaf Dr
- 804 Washington Avenue Extension
- 69 Tree Hill Rd
- 29 Tree Hill Rd
- 15 Tree Hill Rd
- 87 Highland Dr
- 62 Rosemount Ave
- 576 Highland Ave
- 49 Southridge Dr
- 165 Birchwood St
- 127 Fairfield Ave
- 70 Lawlor St
- 70 Vail St
- 77 Eastfield Rd
- 145 Seymour St
- 59 Addison St
- 55 Eastfield Rd
- 35 Hewey St
- 36 Norman St
- 571 Wilson St
- 405 Chipman Street Extension
- 425 Chipman Extension Unit 1st floor
- 405 Chipman St
- 414 Chipman Street Extension
- 414 Chipman St
- 395 Chipman Street Extension
- 7 Old Colony Dr
- 425 Chipman St
- 428 Chipman Street Extension
- 443 Chipman St
- 10 Old Colony Dr
- 427 Chipman Street Extension
- 427 Chipman Street Extension
- 427 Chipman Street Extension Unit STREET
- 427 Chipman Street Extension Unit 2
- 427 Chipman Street Extension
- 427 Chipman Street Extension Unit 1st f
- 427 Chipman Street Extension Unit EXT
- 443 Chipman Street Extension
- 389 Chipman St