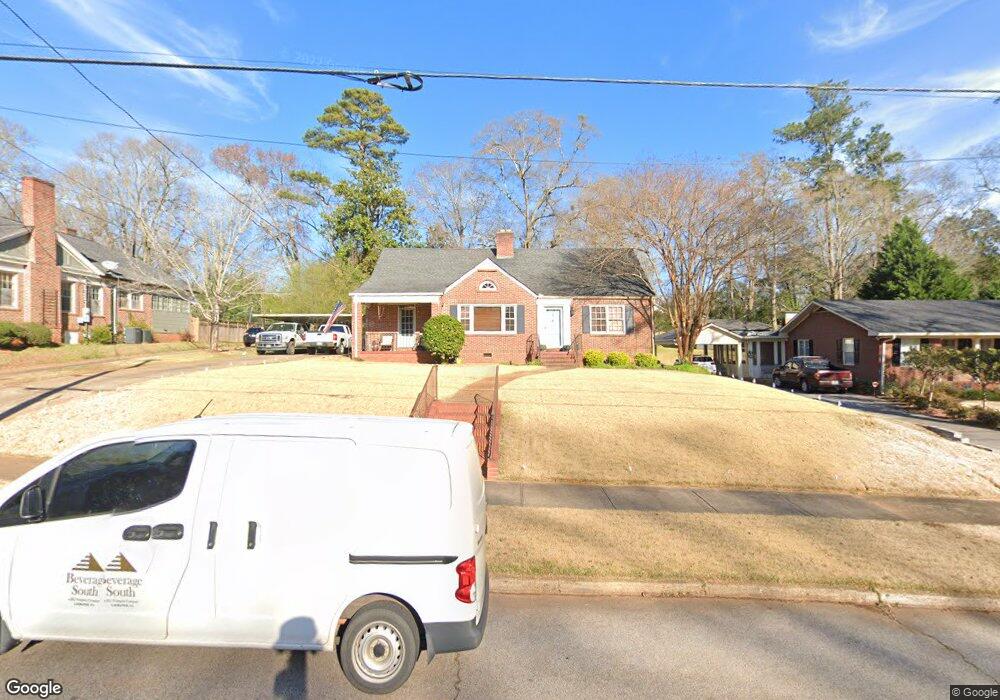
411 College Ave Lagrange, GA 30240
Estimated Value: $217,000 - $278,000
3
Beds
2
Baths
2,289
Sq Ft
$109/Sq Ft
Est. Value
About This Home
This home is located at 411 College Ave, Lagrange, GA 30240 and is currently estimated at $248,501, approximately $108 per square foot. 411 College Ave is a home located in Troup County with nearby schools including Hollis Hand Elementary School, Ethel W. Kight Elementary School, and Franklin Forest Elementary School.
Ownership History
Date
Name
Owned For
Owner Type
Purchase Details
Closed on
Jul 18, 2017
Sold by
Deaton Benjamin T
Bought by
Ramsey Christopher Charles
Current Estimated Value
Home Financials for this Owner
Home Financials are based on the most recent Mortgage that was taken out on this home.
Original Mortgage
$123,717
Outstanding Balance
$101,979
Interest Rate
3.87%
Mortgage Type
FHA
Estimated Equity
$146,522
Purchase Details
Closed on
Feb 25, 2011
Sold by
Parker Richard Henry
Bought by
Deaton Benjamin T
Home Financials for this Owner
Home Financials are based on the most recent Mortgage that was taken out on this home.
Original Mortgage
$102,338
Interest Rate
4.5%
Mortgage Type
FHA
Purchase Details
Closed on
Jun 13, 2008
Sold by
Parker Homer C
Bought by
Parker Eris T
Purchase Details
Closed on
Apr 1, 1946
Bought by
Homer C Parker
Create a Home Valuation Report for This Property
The Home Valuation Report is an in-depth analysis detailing your home's value as well as a comparison with similar homes in the area
Purchase History
We collect this data history from publicly available records. To have your information removed, we recommend requesting removal directly through your county’s website.
| Date | Buyer | Sale Price | Title Company |
|---|---|---|---|
| Ramsey Christopher Charles | $126,000 | -- | |
| Deaton Benjamin T | $105,000 | -- | |
| Deaton Benjamin T | $105,000 | -- | |
| Parker Eris T | -- | -- | |
| Homer C Parker | -- | -- |
Source: Public Records
Mortgage History
We collect this data history from publicly available records. To have your information removed, we recommend requesting removal directly through your county’s website.
| Date | Status | Borrower | Loan Amount |
|---|---|---|---|
| Open | Ramsey Christopher Charles | $123,717 | |
| Previous Owner | Deaton Benjamin T | $102,338 |
Source: Public Records
Tax History
| Year | Tax Paid | Tax Assessment Tax Assessment Total Assessment is a certain percentage of the fair market value that is determined by local assessors to be the total taxable value of land and additions on the property. | Land | Improvement |
|---|---|---|---|---|
| 2025 | $2,073 | $83,852 | $10,000 | $73,852 |
| 2024 | $1,782 | $67,332 | $10,000 | $57,332 |
| 2023 | $1,712 | $64,764 | $10,000 | $54,764 |
| 2022 | $1,644 | $60,884 | $10,000 | $50,884 |
| 2021 | $1,476 | $50,920 | $10,000 | $40,920 |
| 2020 | $1,476 | $50,920 | $10,000 | $40,920 |
| 2019 | $1,153 | $40,224 | $6,160 | $34,064 |
| 2018 | $1,104 | $38,596 | $6,160 | $32,436 |
| 2017 | $1,164 | $38,596 | $6,160 | $32,436 |
| 2016 | $1,168 | $38,736 | $6,160 | $32,576 |
| 2015 | $1,190 | $39,389 | $6,813 | $32,576 |
| 2014 | $1,172 | $38,718 | $6,813 | $31,905 |
| 2013 | -- | $44,278 | $6,776 | $37,502 |
Source: Public Records
Map
Nearby Homes
- 304 Boulevard
- 208 Boulevard
- 408 Harwell Ave
- 207 Wilkes St
- 600 Park Ave
- 405 W Broome St Unit 2
- 405 W Broome St Unit 3
- 405 W Broome St Unit 4
- 405 W Broome St Unit 1
- 405 W Broome St Unit 5
- 217 Jefferson St
- 509 S Lewis St
- 0 N Lee St Unit 10550825
- 310 N Lee St
- 412 S Lee St
- 517 Jefferson St
- TRACT 1 W Haralson St
- 206 Broad St
- 606 Poplar St
- 914 Todd St
- 418 Park Ave
- 412 Park Ave
- 420 Park Ave
- 419 College Ave
- 410 Park Ave
- 410 Park Ave Unit Suite B
- 410 Park Ave Unit Suite A
- 417 Park Ave
- 419 Park Ave
- 423 College Ave
- 423 Park Ave
- 415 Park Ave
- 500 Park Ave
- 408 Park Ave
- 415 College Ave
- 801 Ridge St Unit B
- 801 Ridge St Unit A
- 801 Ridge St
- 413 Park Ave
- 720 Ridge St
Your Personal Tour Guide
Ask me questions while you tour the home.