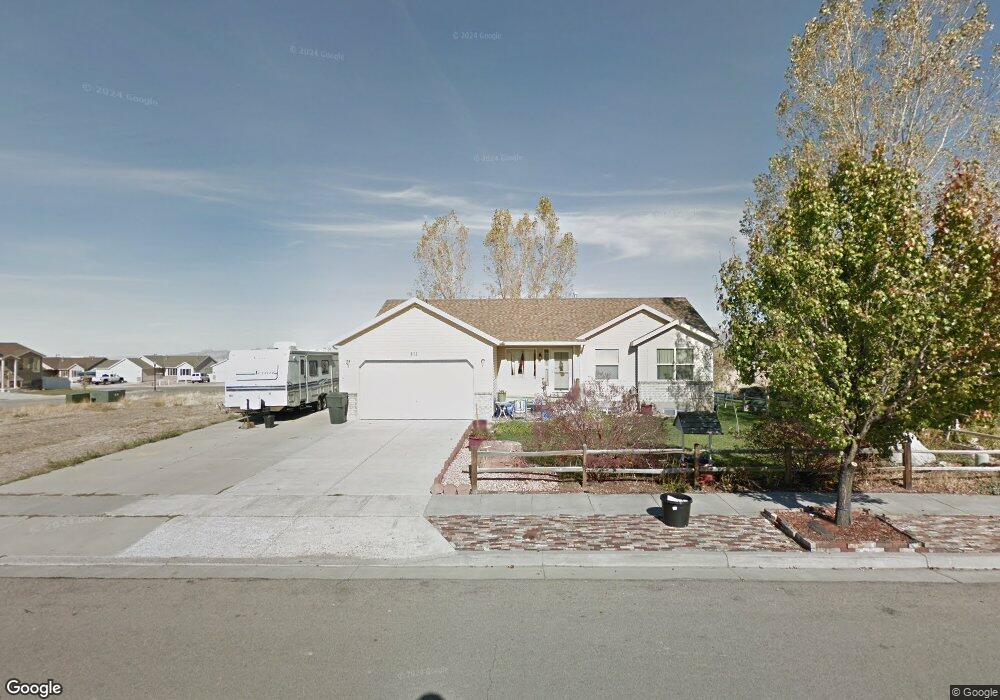
411 E 1480 N Tooele, UT 84074
Estimated Value: $448,000 - $497,000
5
Beds
3
Baths
2,961
Sq Ft
$158/Sq Ft
Est. Value
About This Home
This home is located at 411 E 1480 N, Tooele, UT 84074 and is currently estimated at $467,236, approximately $157 per square foot. 411 E 1480 N is a home located in Tooele County with nearby schools including Copper Canyon Elementary School, Clarke N. Johnsen Junior High School, and Stansbury High School.
Ownership History
Date
Name
Owned For
Owner Type
Purchase Details
Closed on
Sep 4, 2015
Sold by
Jackson Mathew L
Bought by
Jackson Mathew L and Jackson Melanie B
Current Estimated Value
Home Financials for this Owner
Home Financials are based on the most recent Mortgage that was taken out on this home.
Original Mortgage
$215,710
Interest Rate
3.75%
Mortgage Type
FHA
Purchase Details
Closed on
Aug 29, 2008
Sold by
Westenburg Gerald W and Westenburg Patricia L
Bought by
Jackson Mathew L and Jackson Melanie B
Home Financials for this Owner
Home Financials are based on the most recent Mortgage that was taken out on this home.
Original Mortgage
$222,516
Interest Rate
6.27%
Mortgage Type
FHA
Purchase Details
Closed on
Jul 25, 2007
Sold by
Westenburg Gerald W and Westenburg Patricia
Bought by
Westenburg Gerald W and Westenburg Patricia L
Create a Home Valuation Report for This Property
The Home Valuation Report is an in-depth analysis detailing your home's value as well as a comparison with similar homes in the area
Purchase History
| Date | Buyer | Sale Price | Title Company |
|---|---|---|---|
| Jackson Mathew L | -- | Inwest Title | |
| Jackson Mathew L | -- | Inwest Title | |
| Jackson Mathew L | -- | Metro National Title | |
| Westenburg Gerald W | -- | None Available |
Source: Public Records
Mortgage History
| Date | Status | Borrower | Loan Amount |
|---|---|---|---|
| Previous Owner | Jackson Mathew L | $215,710 | |
| Previous Owner | Jackson Mathew L | $222,516 |
Source: Public Records
Tax History
| Year | Tax Paid | Tax Assessment Tax Assessment Total Assessment is a certain percentage of the fair market value that is determined by local assessors to be the total taxable value of land and additions on the property. | Land | Improvement |
|---|---|---|---|---|
| 2025 | $3,122 | $473,463 | $105,000 | $368,463 |
| 2024 | $3,417 | $260,822 | $57,750 | $203,072 |
| 2023 | $3,417 | $275,580 | $54,996 | $220,584 |
| 2022 | $3,154 | $271,359 | $55,000 | $216,359 |
| 2021 | $2,618 | $188,430 | $22,000 | $166,430 |
| 2020 | $2,485 | $310,179 | $40,000 | $270,179 |
| 2019 | $2,326 | $285,617 | $40,000 | $245,617 |
| 2018 | $2,131 | $248,150 | $40,000 | $208,150 |
| 2017 | $1,865 | $257,632 | $30,000 | $227,632 |
| 2016 | $1,511 | $125,368 | $16,500 | $108,868 |
| 2015 | $1,511 | $109,886 | $0 | $0 |
| 2014 | -- | $109,886 | $0 | $0 |
Source: Public Records
Map
Nearby Homes
- 438 E 1480 N
- 1451 N 380 E
- 472 E 1420 N
- 405 E 1310 N
- 475 E 1310 N
- 1154 N Berra Blvd
- 1598 N 210 E Unit 107
- 1618 N 210 E
- 1721 Copper Canyon Dr Unit 1282
- 1741 Copper Canyon Dr Unit 1288
- 1735 Copper Canyon Dr Unit 1286
- 1725 Copper Canyon Dr Unit 1283
- 1833 N Blue Iris Ave Unit 1073
- 1770 N Patchwork Ave Unit 1255
- 1756 N Patchwork Ave Unit 1258
- 1727 N Patchwork Ave Unit 1268
- 1747 N Patchwork Ave Unit 1264
- 1774 N Patchwork Ave Unit 1254
- 1743 N Patchwork Ave Unit 1265
- 1713 N Patchwork Ave Unit 1271
Your Personal Tour Guide
Ask me questions while you tour the home.