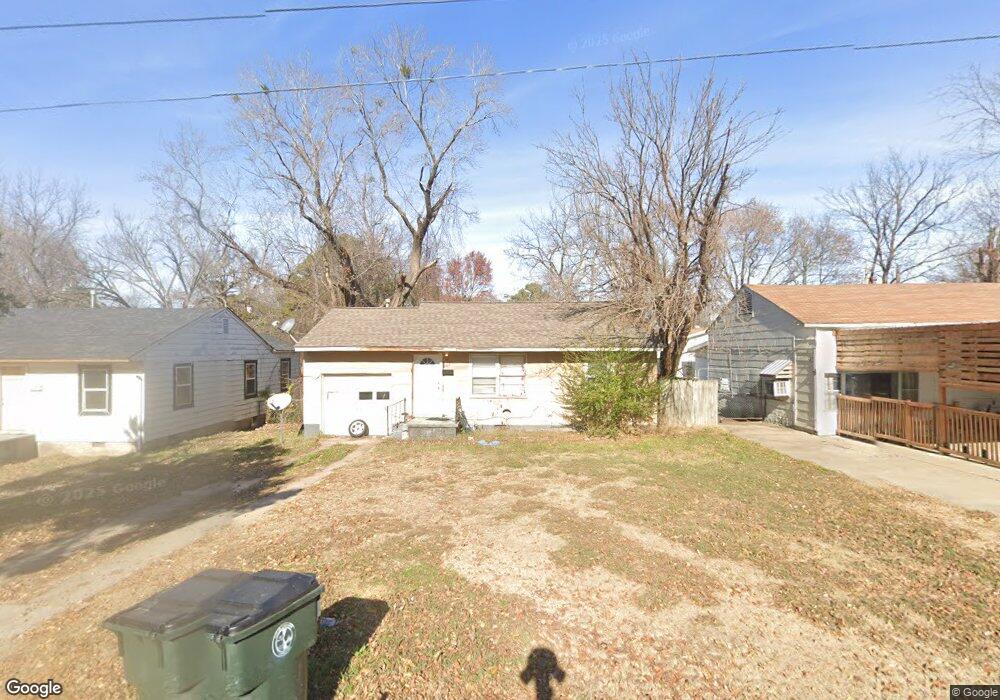
411 E 20th St Okmulgee, OK 74447
Estimated Value: $61,000 - $78,000
2
Beds
1
Bath
675
Sq Ft
$104/Sq Ft
Est. Value
About This Home
This home is located at 411 E 20th St, Okmulgee, OK 74447 and is currently estimated at $70,245, approximately $104 per square foot. 411 E 20th St is a home located in Okmulgee County with nearby schools including Okmulgee Primary School, Okmulgee Middle School, and Dunbar Elementary School.
Ownership History
Date
Name
Owned For
Owner Type
Purchase Details
Closed on
Jul 29, 2022
Sold by
Taylor Investment Properties Llc
Bought by
Martin Fuller Investments Llc
Current Estimated Value
Home Financials for this Owner
Home Financials are based on the most recent Mortgage that was taken out on this home.
Original Mortgage
$637,459
Outstanding Balance
$469,015
Interest Rate
5.78%
Mortgage Type
New Conventional
Estimated Equity
-$398,770
Purchase Details
Closed on
Jul 1, 2008
Sold by
Canaday E A and Canaday Gloria Ann
Bought by
Wise Nicky D
Home Financials for this Owner
Home Financials are based on the most recent Mortgage that was taken out on this home.
Original Mortgage
$31,047
Interest Rate
6.5%
Mortgage Type
FHA
Purchase Details
Closed on
Jul 27, 1998
Sold by
Steven Whitely
Bought by
Canaday E A
Create a Home Valuation Report for This Property
The Home Valuation Report is an in-depth analysis detailing your home's value as well as a comparison with similar homes in the area
Home Values in the Area
Average Home Value in this Area
Purchase History
| Date | Buyer | Sale Price | Title Company |
|---|---|---|---|
| Martin Fuller Investments Llc | $620,000 | None Listed On Document | |
| Wise Nicky D | $26,000 | None Available | |
| Canaday E A | $22,500 | -- |
Source: Public Records
Mortgage History
| Date | Status | Borrower | Loan Amount |
|---|---|---|---|
| Open | Martin Fuller Investments Llc | $637,459 | |
| Previous Owner | Wise Nicky D | $31,047 |
Source: Public Records
Tax History
| Year | Tax Paid | Tax Assessment Tax Assessment Total Assessment is a certain percentage of the fair market value that is determined by local assessors to be the total taxable value of land and additions on the property. | Land | Improvement |
|---|---|---|---|---|
| 2025 | $207 | $2,260 | $372 | $1,888 |
| 2024 | $195 | $2,152 | $372 | $1,780 |
| 2023 | $204 | $2,400 | $372 | $2,028 |
| 2022 | $203 | $2,400 | $372 | $2,028 |
| 2021 | $212 | $2,400 | $372 | $2,028 |
| 2020 | $155 | $1,755 | $186 | $1,569 |
| 2019 | $155 | $1,755 | $186 | $1,569 |
| 2018 | $157 | $1,755 | $186 | $1,569 |
| 2017 | $190 | $2,148 | $186 | $1,962 |
| 2016 | $277 | $3,120 | $186 | $2,934 |
| 2015 | $269 | $3,120 | $186 | $2,934 |
| 2014 | $270 | $3,120 | $186 | $2,934 |
Source: Public Records
Map
Nearby Homes
- 727 E 21st St
- 422 E 24th St
- 907 S Creek Ave
- 814 S Severs St
- 820 S Wood Dr
- 704 S Morton Ave
- 806 E 13th St
- 512 S Muskogee
- 617 S Seminole Ave
- 901 S Florida Ave
- 506 S Delaware Ave
- 516 S Morton Ave
- 1018 S Dogwood Ave
- 627 S Alabama Ave
- 623 W 15th St
- 511 S Okmulgee Ave
- 609 S Alabama Ave
- 322 S Porter Ave
- 708 S Miami Ave
- 724 S Lake Ave
Your Personal Tour Guide
Ask me questions while you tour the home.