Estimated Value: $106,000 - $253,000
3
Beds
1
Bath
1,316
Sq Ft
$149/Sq Ft
Est. Value
About This Home
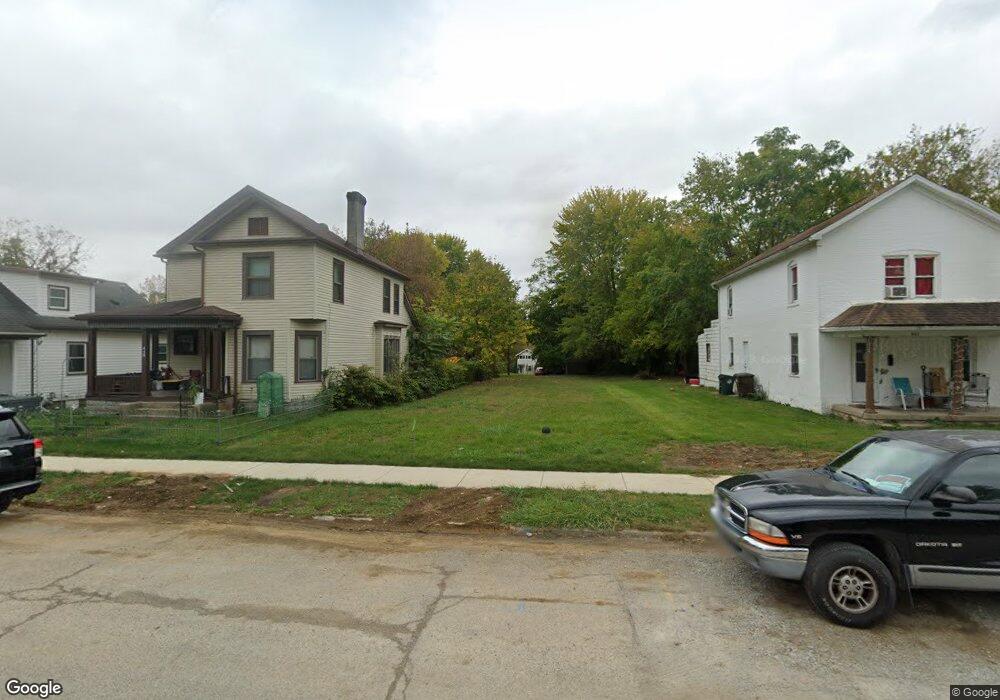
This home is located at 411 E 2nd St, Xenia, OH 45385 and is currently estimated at $196,667, approximately $149 per square foot. 411 E 2nd St is a home located in Greene County with nearby schools including Xenia High School, Summit Academy Community School for Alternative Learners - Xenia, and Legacy Christian Academy.
Ownership History
Date
Name
Owned For
Owner Type
Purchase Details
Closed on
Jun 27, 2003
Sold by
Fry Robert A
Bought by
Fry Allison M
Current Estimated Value
Home Financials for this Owner
Home Financials are based on the most recent Mortgage that was taken out on this home.
Original Mortgage
$48,000
Interest Rate
5.37%
Mortgage Type
Unknown
Purchase Details
Closed on
Dec 22, 1998
Sold by
Fry Allison M
Bought by
Fry Robert A and Fry Allison M
Home Financials for this Owner
Home Financials are based on the most recent Mortgage that was taken out on this home.
Original Mortgage
$41,600
Interest Rate
6.79%
Mortgage Type
Balloon
Purchase Details
Closed on
Oct 27, 1994
Sold by
Fletcher James C
Bought by
Fry Allison M
Create a Home Valuation Report for This Property
The Home Valuation Report is an in-depth analysis detailing your home's value as well as a comparison with similar homes in the area
Home Values in the Area
Average Home Value in this Area
Purchase History
| Date | Buyer | Sale Price | Title Company |
|---|---|---|---|
| Fry Allison M | -- | -- | |
| Fry Robert A | -- | -- | |
| Fry Allison M | $10,500 | -- |
Source: Public Records
Mortgage History
| Date | Status | Borrower | Loan Amount |
|---|---|---|---|
| Previous Owner | Fry Allison M | $48,000 | |
| Previous Owner | Fry Robert A | $41,600 |
Source: Public Records
Tax History
| Year | Tax Paid | Tax Assessment Tax Assessment Total Assessment is a certain percentage of the fair market value that is determined by local assessors to be the total taxable value of land and additions on the property. | Land | Improvement |
|---|---|---|---|---|
| 2024 | $58 | $1,350 | $1,350 | $0 |
| 2023 | $58 | $1,350 | $1,350 | $0 |
| 2022 | $1,846 | $9,970 | $1,230 | $8,740 |
| 2021 | $2,482 | $9,970 | $1,230 | $8,740 |
| 2020 | $3,467 | $9,970 | $1,230 | $8,740 |
| 2019 | $1,419 | $8,620 | $1,250 | $7,370 |
| 2018 | $994 | $8,620 | $1,250 | $7,370 |
| 2017 | $1,109 | $8,620 | $1,250 | $7,370 |
| 2016 | $1,397 | $8,290 | $1,250 | $7,040 |
| 2015 | $5,663 | $8,290 | $1,250 | $7,040 |
| 2014 | $7,638 | $8,290 | $1,250 | $7,040 |
Source: Public Records
Map
Nearby Homes
Your Personal Tour Guide
Ask me questions while you tour the home.