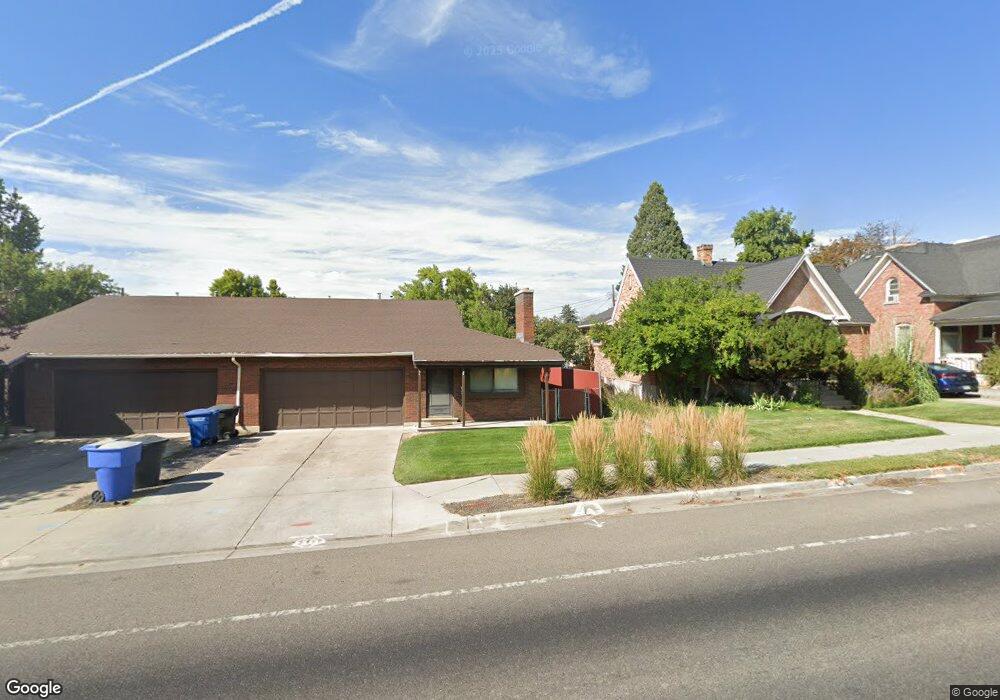
411 E 400 N Logan, UT 84321
Adams NeighborhoodEstimated Value: $317,414 - $436,000
2
Beds
2
Baths
1,260
Sq Ft
$310/Sq Ft
Est. Value
About This Home
This home is located at 411 E 400 N, Logan, UT 84321 and is currently estimated at $390,604, approximately $310 per square foot. 411 E 400 N is a home located in Cache County with nearby schools including Adams Elementary School, Mount Logan Middle School, and Logan High School.
Ownership History
Date
Name
Owned For
Owner Type
Purchase Details
Closed on
Mar 5, 2010
Sold by
Hsbc Bank Usa National Association
Bought by
Kartsone C John and Kartsone Tracey H
Current Estimated Value
Home Financials for this Owner
Home Financials are based on the most recent Mortgage that was taken out on this home.
Original Mortgage
$73,500
Interest Rate
5.03%
Mortgage Type
New Conventional
Purchase Details
Closed on
Nov 4, 2009
Sold by
Robinson F Greg
Bought by
Hsbc Bank Usa National Association
Purchase Details
Closed on
Mar 19, 2007
Sold by
Robinson F Greg
Bought by
Robinson F Greg and Robinson Julie M
Create a Home Valuation Report for This Property
The Home Valuation Report is an in-depth analysis detailing your home's value as well as a comparison with similar homes in the area
Home Values in the Area
Average Home Value in this Area
Purchase History
| Date | Buyer | Sale Price | Title Company |
|---|---|---|---|
| Kartsone C John | -- | None Available | |
| Hsbc Bank Usa National Association | $92,650 | Backman Title Services | |
| Robinson F Greg | -- | Cache Title Company |
Source: Public Records
Mortgage History
| Date | Status | Borrower | Loan Amount |
|---|---|---|---|
| Previous Owner | Kartsone C John | $73,500 |
Source: Public Records
Tax History
| Year | Tax Paid | Tax Assessment Tax Assessment Total Assessment is a certain percentage of the fair market value that is determined by local assessors to be the total taxable value of land and additions on the property. | Land | Improvement |
|---|---|---|---|---|
| 2025 | $1,365 | $320,964 | $91,800 | $229,164 |
| 2024 | $1,409 | $320,964 | $91,800 | $229,164 |
| 2023 | $1,470 | $319,164 | $90,000 | $229,164 |
| 2022 | $1,574 | $319,164 | $90,000 | $229,164 |
| 2021 | $1,198 | $206,280 | $30,000 | $176,280 |
| 2020 | $1,141 | $176,900 | $30,000 | $146,900 |
| 2019 | $1,149 | $170,486 | $30,000 | $140,486 |
| 2018 | $1,101 | $149,056 | $30,000 | $119,056 |
| 2017 | $1,047 | $74,965 | $0 | $0 |
| 2016 | $1,085 | $68,365 | $0 | $0 |
| 2015 | $991 | $68,365 | $0 | $0 |
| 2014 | $734 | $56,015 | $0 | $0 |
| 2013 | -- | $56,015 | $0 | $0 |
Source: Public Records
Map
Nearby Homes
Your Personal Tour Guide
Ask me questions while you tour the home.