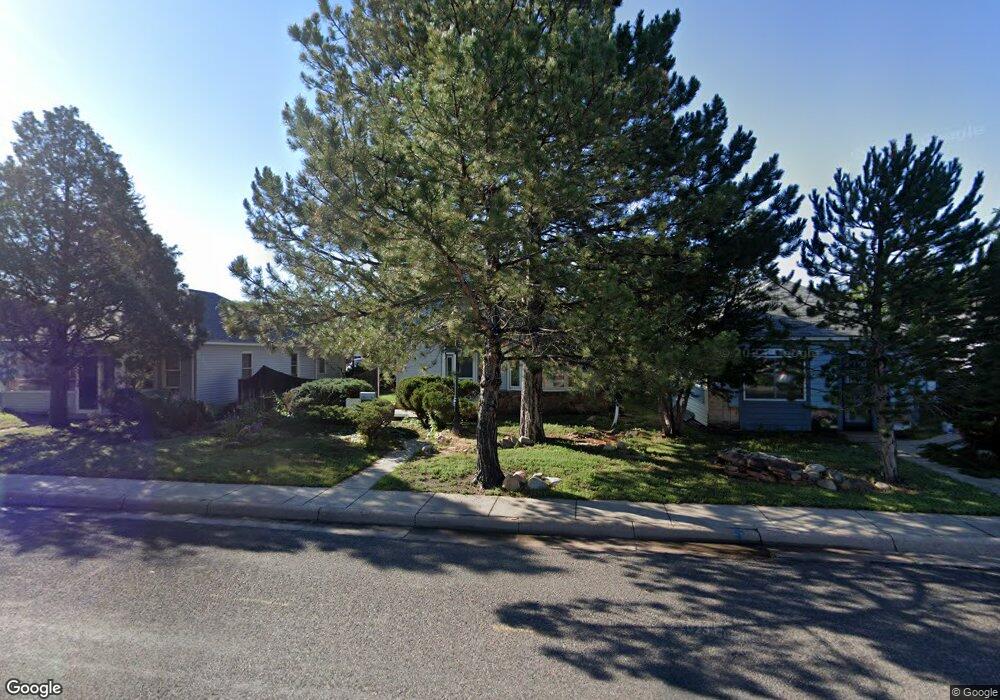
411 E 9th St Cheyenne, WY 82007
South Cheyenne NeighborhoodEstimated Value: $295,000 - $322,000
Studio
--
Bath
1,626
Sq Ft
$192/Sq Ft
Est. Value
About This Home
This home is located at 411 E 9th St, Cheyenne, WY 82007 and is currently estimated at $312,025, approximately $191 per square foot. 411 E 9th St is a home located in Laramie County with nearby schools including Hebard Elementary School, Johnson Junior High School, and South High School.
Ownership History
Date
Name
Owned For
Owner Type
Purchase Details
Closed on
Dec 22, 2006
Sold by
Burry Robert W and Burry Patricia
Bought by
Burry Robert W and Burry Patricia
Current Estimated Value
Home Financials for this Owner
Home Financials are based on the most recent Mortgage that was taken out on this home.
Original Mortgage
$142,500
Outstanding Balance
$84,677
Interest Rate
6.2%
Mortgage Type
Stand Alone Refi Refinance Of Original Loan
Estimated Equity
$227,348
Purchase Details
Closed on
Dec 21, 1998
Sold by
Mitchell Jack L and Mitchell Jean K
Bought by
Burry Robert W
Home Financials for this Owner
Home Financials are based on the most recent Mortgage that was taken out on this home.
Original Mortgage
$88,241
Interest Rate
6.92%
Mortgage Type
FHA
Create a Home Valuation Report for This Property
The Home Valuation Report is an in-depth analysis detailing your home's value as well as a comparison with similar homes in the area
Home Values in the Area
Average Home Value in this Area
Purchase History
| Date | Buyer | Sale Price | Title Company |
|---|---|---|---|
| Burry Robert W | -- | None Available | |
| Burry Robert W | -- | -- |
Source: Public Records
Mortgage History
| Date | Status | Borrower | Loan Amount |
|---|---|---|---|
| Open | Burry Robert W | $142,500 | |
| Closed | Burry Robert W | $88,241 |
Source: Public Records
Tax History
| Year | Tax Paid | Tax Assessment Tax Assessment Total Assessment is a certain percentage of the fair market value that is determined by local assessors to be the total taxable value of land and additions on the property. | Land | Improvement |
|---|---|---|---|---|
| 2025 | $2,177 | $22,976 | $1,563 | $21,413 |
| 2024 | $2,177 | $29,536 | $2,084 | $27,452 |
| 2023 | $2,099 | $28,480 | $2,084 | $26,396 |
| 2022 | $1,728 | $22,980 | $1,241 | $21,739 |
| 2021 | $1,572 | $20,859 | $1,197 | $19,662 |
| 2020 | $1,386 | $18,444 | $1,081 | $17,363 |
| 2019 | $1,322 | $17,580 | $1,081 | $16,499 |
| 2018 | $1,207 | $16,199 | $1,081 | $15,118 |
| 2017 | $1,200 | $15,965 | $1,002 | $14,963 |
| 2016 | $1,187 | $15,778 | $1,002 | $14,776 |
| 2015 | $1,142 | $15,175 | $1,002 | $14,173 |
| 2014 | $1,169 | $15,440 | $1,188 | $14,252 |
Source: Public Records
Map
Nearby Homes
Your Personal Tour Guide
Ask me questions while you tour the home.