Estimated Value: $56,594 - $69,000
3
Beds
1
Bath
1,134
Sq Ft
$56/Sq Ft
Est. Value
About This Home
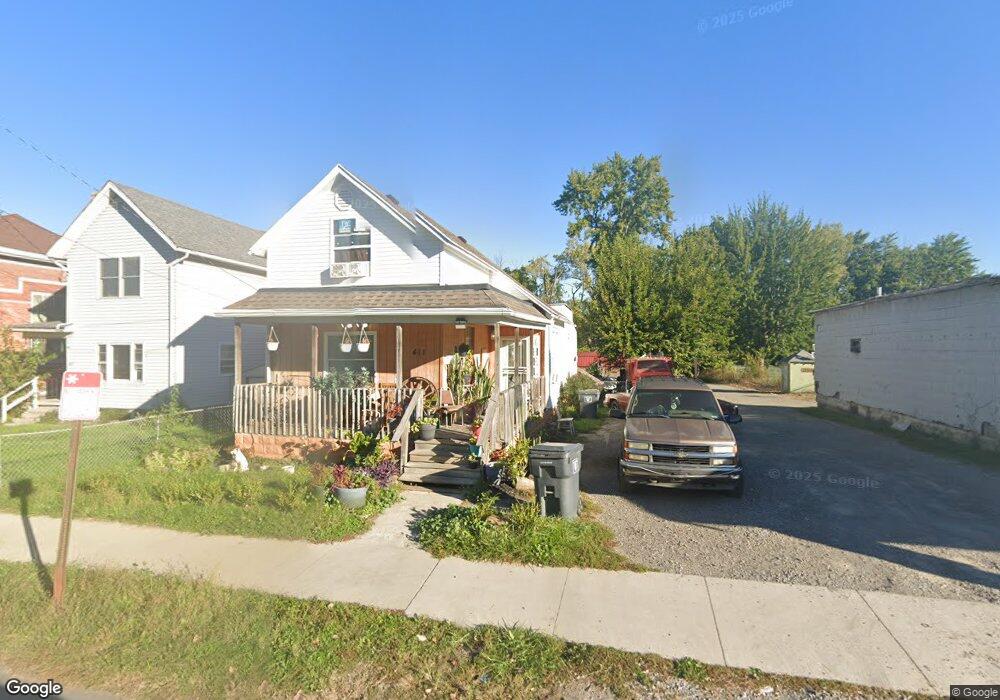
This home is located at 411 E Kibby St, Lima, OH 45804 and is currently estimated at $63,865, approximately $56 per square foot. 411 E Kibby St is a home located in Allen County with nearby schools including Freedom Elementary School, Lima North Middle School, and Lima West Middle School.
Ownership History
Date
Name
Owned For
Owner Type
Purchase Details
Closed on
Jan 18, 2011
Sold by
Treglia Nathan and Treglia Jennifer
Bought by
Green Millard T
Current Estimated Value
Home Financials for this Owner
Home Financials are based on the most recent Mortgage that was taken out on this home.
Original Mortgage
$3,250
Outstanding Balance
$2,202
Interest Rate
4.65%
Mortgage Type
Seller Take Back
Estimated Equity
$61,663
Purchase Details
Closed on
Dec 11, 2006
Sold by
French Bruce
Bought by
Allen County Leasing Inc
Purchase Details
Closed on
Jan 13, 2000
Sold by
Swallow Robert E
Bought by
Treglia Nathan
Purchase Details
Closed on
Aug 20, 1999
Sold by
Patton Ginger
Bought by
Swallow Robert
Purchase Details
Closed on
Mar 16, 1988
Bought by
Patton Ginger Ann
Create a Home Valuation Report for This Property
The Home Valuation Report is an in-depth analysis detailing your home's value as well as a comparison with similar homes in the area
Purchase History
| Date | Buyer | Sale Price | Title Company |
|---|---|---|---|
| Green Millard T | $3,500 | Attorney | |
| Allen County Leasing Inc | $305,000 | None Available | |
| Treglia Nathan | $4,300 | -- | |
| Swallow Robert | $6,000 | -- | |
| Patton Ginger Ann | $5,500 | -- |
Source: Public Records
Mortgage History
| Date | Status | Borrower | Loan Amount |
|---|---|---|---|
| Open | Green Millard T | $3,250 |
Source: Public Records
Tax History
| Year | Tax Paid | Tax Assessment Tax Assessment Total Assessment is a certain percentage of the fair market value that is determined by local assessors to be the total taxable value of land and additions on the property. | Land | Improvement |
|---|---|---|---|---|
| 2024 | $158 | $8,090 | $1,050 | $7,040 |
| 2023 | $109 | $7,710 | $1,020 | $6,690 |
| 2022 | $118 | $6,620 | $1,020 | $5,600 |
| 2021 | $67 | $6,620 | $1,020 | $5,600 |
| 2020 | $65 | $8,160 | $1,020 | $7,140 |
| 2019 | $65 | $8,160 | $1,020 | $7,140 |
| 2018 | $65 | $8,160 | $1,020 | $7,140 |
| 2017 | $65 | $8,160 | $1,020 | $7,140 |
| 2016 | $118 | $8,160 | $1,020 | $7,140 |
| 2015 | $64 | $8,160 | $1,020 | $7,140 |
| 2014 | $64 | $8,440 | $1,090 | $7,350 |
| 2013 | $64 | $8,440 | $1,090 | $7,350 |
Source: Public Records
Map
Nearby Homes
- 407 E Kibby St
- 417 E Kibby St
- 439 S Jackson St
- 402 E Kibby St
- 448 S Jackson St
- 444 S Jackson St
- 352 E Kibby St
- 430 S Pine St
- 429 S Jackson St
- 428 E Kibby St
- 408 E Kibby St
- 406 E Kibby St
- 425 S Jackson St
- 424 S Pine St
- 346 E Kibby St
- 423 S Jackson St
- 344 E Kibby St
- 430 S Jackson St
- 420 S Pine St
- 421 S Jackson St
Your Personal Tour Guide
Ask me questions while you tour the home.