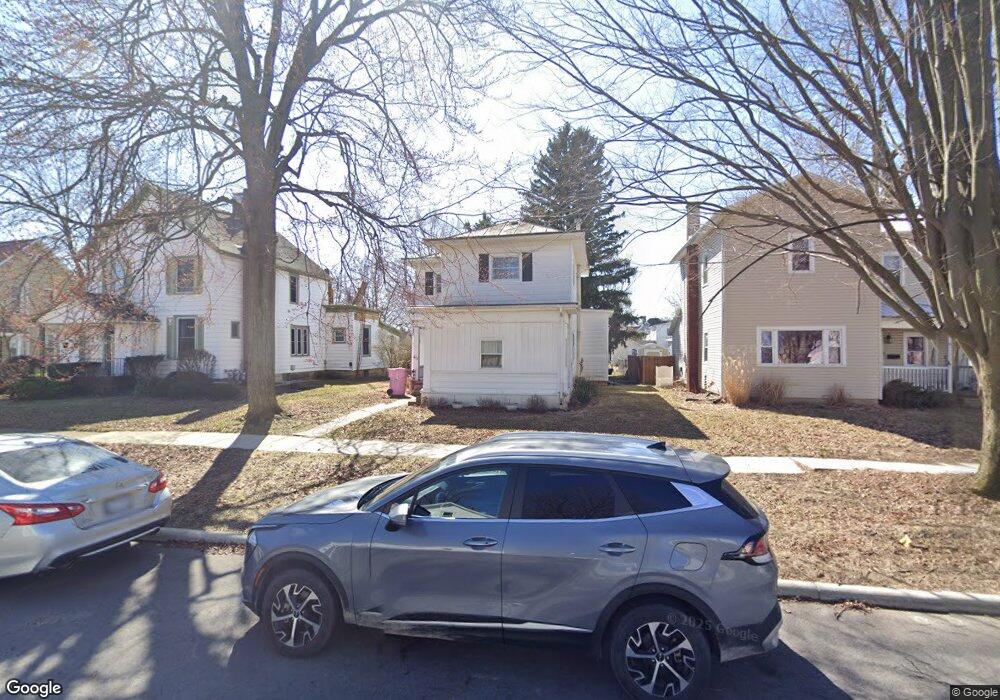
411 E Lima St Findlay, OH 45840
Estimated Value: $158,051 - $265,000
4
Beds
3
Baths
1,750
Sq Ft
$117/Sq Ft
Est. Value
About This Home
This home is located at 411 E Lima St, Findlay, OH 45840 and is currently estimated at $204,763, approximately $117 per square foot. 411 E Lima St is a home located in Hancock County with nearby schools including Lincoln Elementary School, Donnell Middle School, and Findlay High School.
Ownership History
Date
Name
Owned For
Owner Type
Purchase Details
Closed on
Jul 3, 2014
Sold by
Stalsworth William J and Stalsworth Andrea J
Bought by
Oberlitner Debra K
Current Estimated Value
Purchase Details
Closed on
Nov 11, 2011
Sold by
Neff Scott A and Neff Sibylle
Bought by
Stalsworth William J and Stalsworth Andrea J
Purchase Details
Closed on
May 18, 2011
Sold by
Gmac Mortgage Llc
Bought by
Neff Scott A and Neff Sibylle
Purchase Details
Closed on
Mar 8, 2011
Sold by
Bourret Cynthia
Bought by
Gmac Mortgage Llc
Purchase Details
Closed on
Sep 23, 1998
Sold by
Collier Sandra
Bought by
Bourret Daniel and Bourret Cynthia
Home Financials for this Owner
Home Financials are based on the most recent Mortgage that was taken out on this home.
Original Mortgage
$67,000
Interest Rate
6.99%
Mortgage Type
New Conventional
Purchase Details
Closed on
Jun 13, 1988
Bought by
Collier Sandra L
Purchase Details
Closed on
Feb 10, 1988
Bought by
Gary Mary
Purchase Details
Closed on
Aug 23, 1982
Bought by
Yost Marcus E
Create a Home Valuation Report for This Property
The Home Valuation Report is an in-depth analysis detailing your home's value as well as a comparison with similar homes in the area
Home Values in the Area
Average Home Value in this Area
Purchase History
| Date | Buyer | Sale Price | Title Company |
|---|---|---|---|
| Oberlitner Debra K | $38,100 | Attorney | |
| Stalsworth William J | $63,000 | Attorney | |
| Neff Scott A | $154,333 | Mid Am Title Agency | |
| Gmac Mortgage Llc | $13,334 | None Available | |
| Bourret Daniel | $67,000 | -- | |
| Collier Sandra L | $42,700 | -- | |
| Gary Mary | -- | -- | |
| Yost Marcus E | -- | -- |
Source: Public Records
Mortgage History
| Date | Status | Borrower | Loan Amount |
|---|---|---|---|
| Previous Owner | Bourret Daniel | $67,000 |
Source: Public Records
Tax History
| Year | Tax Paid | Tax Assessment Tax Assessment Total Assessment is a certain percentage of the fair market value that is determined by local assessors to be the total taxable value of land and additions on the property. | Land | Improvement |
|---|---|---|---|---|
| 2024 | $1,485 | $41,810 | $5,920 | $35,890 |
| 2023 | $1,488 | $41,810 | $5,920 | $35,890 |
| 2022 | $1,482 | $41,810 | $5,920 | $35,890 |
| 2021 | $1,265 | $31,090 | $5,920 | $25,170 |
| 2020 | $1,265 | $31,090 | $5,920 | $25,170 |
| 2019 | $1,240 | $31,090 | $5,920 | $25,170 |
| 2018 | $1,177 | $27,040 | $5,150 | $21,890 |
| 2017 | $437 | $19,990 | $4,740 | $15,250 |
| 2016 | $3,238 | $19,990 | $4,740 | $15,250 |
| 2015 | $874 | $19,990 | $4,740 | $15,250 |
| 2014 | $874 | $19,990 | $4,740 | $15,250 |
| 2012 | $942 | $21,320 | $4,740 | $16,580 |
Source: Public Records
Map
Nearby Homes
- 829 Maple Ave
- 216 1st St
- 865 S Main St
- 623 E Sandusky St
- 815 Liberty St
- 123 Glendale Ave
- 206 Greenlawn Ave
- 514 Liberty St
- 412 Lima Ave
- 845 Hurd Ave
- 15591 Canadian Way
- 15586 Canadian Way
- 15615 Canadian Way
- 423 Elm St
- 860 Hurd Ave
- 731 5th St
- 1113 Hurd Ave
- 1304 Douglas Pkwy
- 527 W Sandusky St
- 523 Center St
- 415 E Lima St
- 415 E Lima St Unit 415 upper
- 407 E Lima St
- 811 Washington Ave
- 815 Washington Ave
- 403 E Lima St
- 419 E Lima St
- 821 Washington Ave
- 823 Washington Ave
- 420 E Lima St
- 501 E Lima St
- 329 E Lima St
- 814 Washington Ave
- 818 Park St
- 827 Washington Ave
- 424 E Lima St
- 416 E Lima St
- 416 E Lima St Unit 418
- 505 E Lima St
- 822 Park St
Your Personal Tour Guide
Ask me questions while you tour the home.