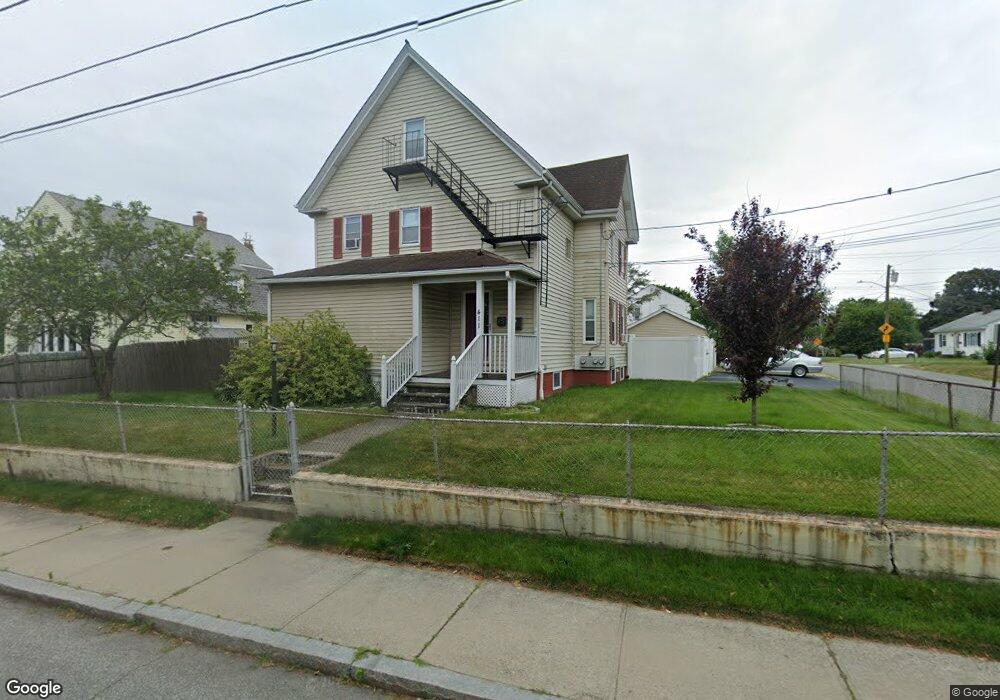
411 Fort St Unit 2 East Providence, RI 02914
Outer East Bay NeighborhoodEstimated Value: $536,232 - $657,000
2
Beds
2
Baths
1,200
Sq Ft
$515/Sq Ft
Est. Value
About This Home
This home is located at 411 Fort St Unit 2, East Providence, RI 02914 and is currently estimated at $618,308, approximately $515 per square foot. 411 Fort St Unit 2 is a home located in Providence County with nearby schools including East Providence High School, The Gordon School, and Ocean State Montessori School.
Ownership History
Date
Name
Owned For
Owner Type
Purchase Details
Closed on
Aug 5, 2024
Sold by
Luiz Joseph F
Bought by
Joseph F Luiz Ret and Luiz
Current Estimated Value
Purchase Details
Closed on
Oct 3, 2019
Sold by
Pacheco Carlos and Pacheco Laudalina
Bought by
Luiz Joseph F
Purchase Details
Closed on
Jul 9, 2010
Sold by
Macinnes Timothy and Macinnes Fhlmc
Bought by
Fhlmc
Purchase Details
Closed on
Jun 5, 2003
Sold by
Paquin Raymond and Paquin Karen
Bought by
Olsen Bonnie and Murray Timothy
Purchase Details
Closed on
Dec 16, 1998
Sold by
Enos David R and Enos Lori
Bought by
Ruhle Christopher F and Lefebvre Christin E
Purchase Details
Closed on
Feb 23, 1989
Sold by
Rose Jeffrey
Bought by
Enos David R
Create a Home Valuation Report for This Property
The Home Valuation Report is an in-depth analysis detailing your home's value as well as a comparison with similar homes in the area
Home Values in the Area
Average Home Value in this Area
Purchase History
| Date | Buyer | Sale Price | Title Company |
|---|---|---|---|
| Joseph F Luiz Ret | -- | None Available | |
| Joseph F Luiz Ret | -- | None Available | |
| Luiz Joseph F | $330,000 | -- | |
| Luiz Joseph F | $330,000 | -- | |
| Fhlmc | $207,000 | -- | |
| Fhlmc | $207,000 | -- | |
| Olsen Bonnie | $225,000 | -- | |
| Olsen Bonnie | $225,000 | -- | |
| Ruhle Christopher F | $140,000 | -- | |
| Ruhle Christopher F | $140,000 | -- | |
| Enos David R | $181,000 | -- | |
| Enos David R | $181,000 | -- |
Source: Public Records
Mortgage History
| Date | Status | Borrower | Loan Amount |
|---|---|---|---|
| Previous Owner | Enos David R | $46,100 | |
| Previous Owner | Enos David R | $256,000 |
Source: Public Records
Tax History Compared to Growth
Tax History
| Year | Tax Paid | Tax Assessment Tax Assessment Total Assessment is a certain percentage of the fair market value that is determined by local assessors to be the total taxable value of land and additions on the property. | Land | Improvement |
|---|---|---|---|---|
| 2025 | $7,707 | $589,700 | $102,400 | $487,300 |
| 2024 | $6,367 | $415,300 | $85,300 | $330,000 |
| 2023 | $6,130 | $415,300 | $85,300 | $330,000 |
| 2022 | $5,987 | $273,900 | $44,400 | $229,500 |
| 2021 | $5,889 | $273,900 | $40,500 | $233,400 |
| 2020 | $5,640 | $273,900 | $40,500 | $233,400 |
| 2019 | $5,483 | $273,900 | $40,500 | $233,400 |
| 2018 | $5,203 | $227,400 | $42,700 | $184,700 |
| 2017 | $5,087 | $227,400 | $42,700 | $184,700 |
| 2016 | $5,062 | $227,400 | $42,700 | $184,700 |
| 2015 | $5,519 | $240,500 | $52,700 | $187,800 |
| 2014 | $5,519 | $240,500 | $52,700 | $187,800 |
Source: Public Records
Map
Nearby Homes
- 400 Juniper St Unit C
- 400 Juniper St Unit B
- 400 Juniper St Unit A
- 78 Ingraham St
- 322 Mauran Ave
- 109 Bliss St
- 195 Lyon Ave Unit 197
- 108 Bliss St
- 74 Brookhaven Dr
- 15 S Carpenter St
- 4 S Carpenter St
- 1402 S Broadway
- 320 Mauran Ave
- 152 Freeborn Ave
- 82 Martin St
- 17 Brown St Unit 19
- 164 Brightridge Ave
- 18 Baker St Unit 20
- 180 Grassmere Ave
- 1463 S Broadway