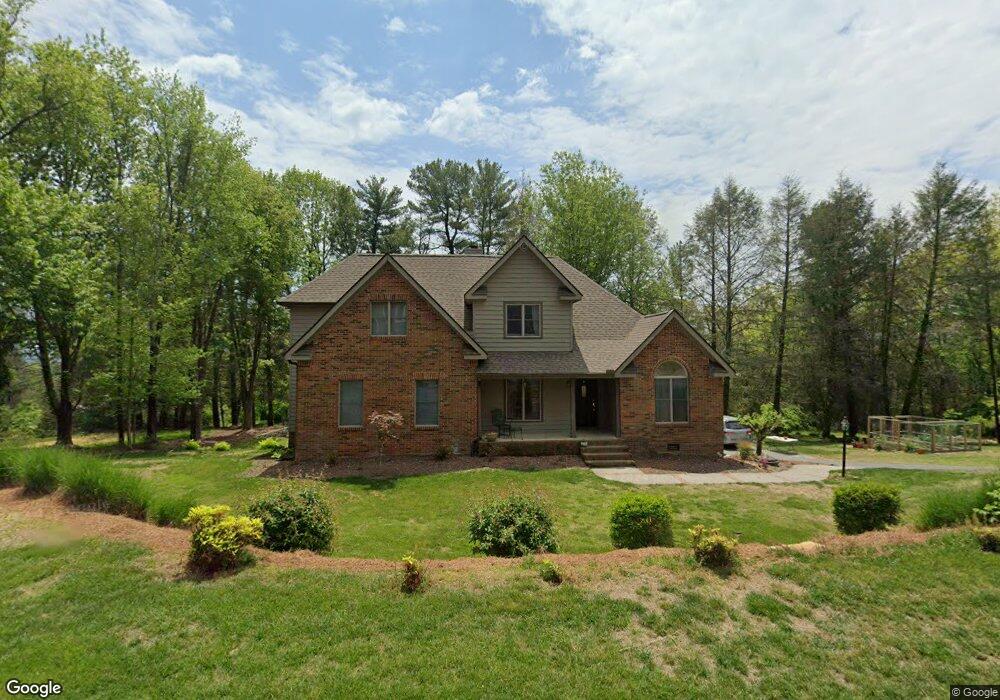
411 Fort Trace Lookout Mountain, GA 30750
Estimated Value: $596,846 - $766,000
--
Bed
2
Baths
2,638
Sq Ft
$256/Sq Ft
Est. Value
About This Home
This home is located at 411 Fort Trace, Lookout Mountain, GA 30750 and is currently estimated at $676,212, approximately $256 per square foot. 411 Fort Trace is a home located in Walker County with nearby schools including Fairyland Elementary School, Chattanooga Valley Middle School, and Ridgeland High School.
Ownership History
Date
Name
Owned For
Owner Type
Purchase Details
Closed on
Apr 3, 2025
Sold by
Reed John K
Bought by
Reed Family Revocable Living Trust and Reed Diana Lee Tr
Current Estimated Value
Purchase Details
Closed on
Jun 3, 2020
Sold by
Dennison William D
Bought by
Reed John K and Reed Diana L
Home Financials for this Owner
Home Financials are based on the most recent Mortgage that was taken out on this home.
Original Mortgage
$276,000
Interest Rate
3.2%
Mortgage Type
New Conventional
Purchase Details
Closed on
Jan 3, 1994
Sold by
Donnovin Anne A
Bought by
Dennison William D and Dennison Patricia
Purchase Details
Closed on
Sep 30, 1992
Sold by
Donnovin Joseph P and Donnovin Anne A
Bought by
Donnovin Anne A
Purchase Details
Closed on
Feb 17, 1987
Sold by
Robert L Brown
Bought by
Donnovin Joseph P and Donnovin Anne A
Purchase Details
Closed on
Jan 1, 1972
Bought by
Robert L Brown
Create a Home Valuation Report for This Property
The Home Valuation Report is an in-depth analysis detailing your home's value as well as a comparison with similar homes in the area
Home Values in the Area
Average Home Value in this Area
Purchase History
| Date | Buyer | Sale Price | Title Company |
|---|---|---|---|
| Reed Family Revocable Living Trust | -- | -- | |
| Reed John K | $345,000 | -- | |
| Dennison William D | $22,000 | -- | |
| Donnovin Anne A | -- | -- | |
| Donnovin Joseph P | $11,000 | -- | |
| Robert L Brown | -- | -- |
Source: Public Records
Mortgage History
| Date | Status | Borrower | Loan Amount |
|---|---|---|---|
| Previous Owner | Reed John K | $276,000 |
Source: Public Records
Tax History Compared to Growth
Tax History
| Year | Tax Paid | Tax Assessment Tax Assessment Total Assessment is a certain percentage of the fair market value that is determined by local assessors to be the total taxable value of land and additions on the property. | Land | Improvement |
|---|---|---|---|---|
| 2024 | $6,401 | $215,725 | $19,800 | $195,925 |
| 2023 | $6,590 | $215,955 | $19,800 | $196,155 |
| 2022 | $4,474 | $169,963 | $19,800 | $150,163 |
| 2021 | $4,053 | $145,332 | $19,800 | $125,532 |
| 2020 | $974 | $115,980 | $19,800 | $96,180 |
| 2019 | $3,333 | $115,980 | $19,800 | $96,180 |
| 2018 | $3,451 | $115,980 | $19,800 | $96,180 |
| 2017 | $3,638 | $115,980 | $19,800 | $96,180 |
| 2016 | $2,136 | $93,491 | $7,920 | $85,571 |
| 2015 | $3,215 | $113,083 | $26,016 | $87,067 |
| 2014 | $3,095 | $113,083 | $26,016 | $87,067 |
| 2013 | -- | $113,083 | $26,016 | $87,067 |
Source: Public Records
Map
Nearby Homes
- 302 Mcfarland Rd
- 401 Mcfarland Rd
- 1300 Elfin Rd
- 1212 Cinderella Rd
- 1612 Lula Lake Rd
- 0 Fleetwood Dr Unit RTC2957879
- 0 Fleetwood Dr Unit 1517351
- 196 Fort Stephenson Place
- 891 Fleetwood Dr
- 0 Tinker Bell Cir Unit LOT 27 10563269
- 0 Tinker Bell Cir Unit 1510010
- 219 Gnome Trail
- 504 Fleetwood Dr
- 1601 Wood Nymph Trail
- 1007 Evanwood Dr
- 1613 Fairy Dell Trail
- 118 Fleetwood Dr
- 105 N Forrest Ave
- 202 Prospect Way
- 307 Park Rd
- 411 Fort Trace Rd
- 410 Fort Trace Rd
- 0 Fort Trace Rd Unit 1335341
- 0 Fort Trace Rd
- 408 Fort Trace Rd
- 204 Mcfarland Rd
- 204 Mcfarland Rd
- 204 Mcfarland Rd
- 408 Fort Trace
- 406 Fort Trace Rd
- 410 Fort Trace
- 406 Fort Trace
- 415 Fort Trace
- 413 Fort Trace Rd
- 413 Fort Trace
- 405 Fort Trace
- 402 Fort Trace Rd
- 200 Mcfarland Rd
- 416 Fort Trace
- 402 Fort Trace