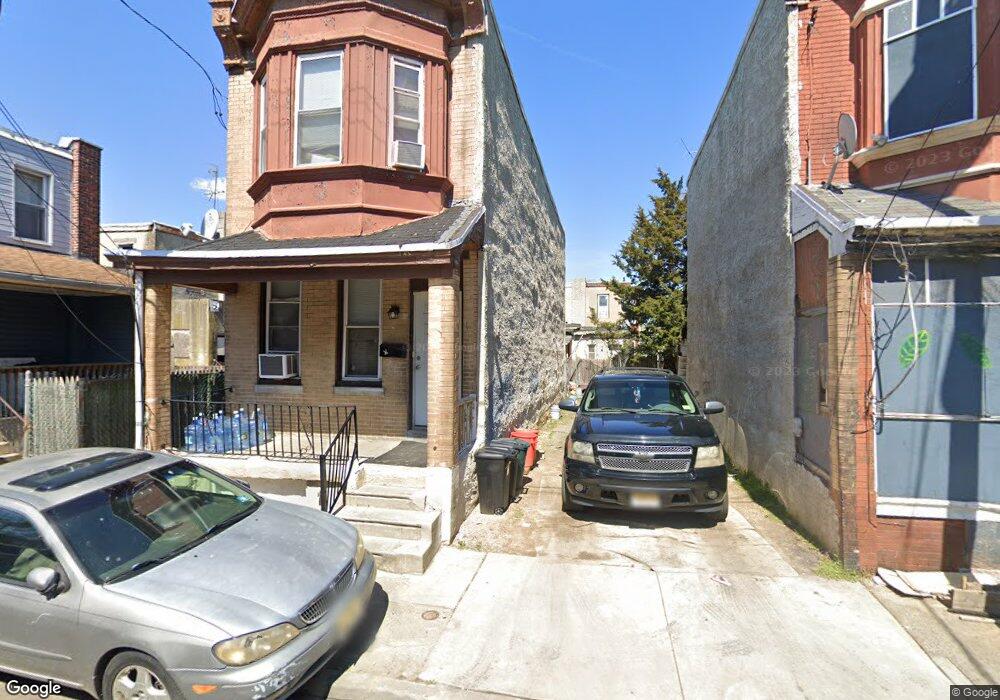
411 Grant St Camden, NJ 08102
North Camden NeighborhoodEstimated Value: $101,181 - $168,000
--
Bed
--
Bath
1,351
Sq Ft
$104/Sq Ft
Est. Value
About This Home
This home is located at 411 Grant St, Camden, NJ 08102 and is currently estimated at $141,045, approximately $104 per square foot. 411 Grant St is a home located in Camden County with nearby schools including Cooper's Poynt Elementary School, Eastside High School, and Leap Academy University Charter School.
Ownership History
Date
Name
Owned For
Owner Type
Purchase Details
Closed on
Jun 8, 2016
Sold by
Spignolio Idalia E
Bought by
Nas Property Management Llc
Current Estimated Value
Purchase Details
Closed on
Oct 5, 2015
Sold by
Rivera Rosa
Bought by
Spignolio Idalia E
Purchase Details
Closed on
Aug 23, 2013
Sold by
Jones Edwin
Bought by
Rivera Rosa
Purchase Details
Closed on
May 9, 2005
Sold by
Samuel Rosa Est Of
Bought by
Jones Edwin L
Create a Home Valuation Report for This Property
The Home Valuation Report is an in-depth analysis detailing your home's value as well as a comparison with similar homes in the area
Home Values in the Area
Average Home Value in this Area
Purchase History
| Date | Buyer | Sale Price | Title Company |
|---|---|---|---|
| Nas Property Management Llc | $5,000 | None Available | |
| Spignolio Idalia E | -- | Attorney | |
| Rivera Rosa | $1,000 | None Available | |
| Jones Edwin L | $5,500 | -- |
Source: Public Records
Tax History Compared to Growth
Tax History
| Year | Tax Paid | Tax Assessment Tax Assessment Total Assessment is a certain percentage of the fair market value that is determined by local assessors to be the total taxable value of land and additions on the property. | Land | Improvement |
|---|---|---|---|---|
| 2025 | $1,807 | $51,000 | $5,900 | $45,100 |
| 2024 | $1,747 | $51,000 | $5,900 | $45,100 |
| 2023 | $1,747 | $51,000 | $5,900 | $45,100 |
| 2022 | $1,714 | $51,000 | $5,900 | $45,100 |
| 2021 | $1,629 | $51,000 | $5,900 | $45,100 |
| 2020 | $1,622 | $51,000 | $5,900 | $45,100 |
| 2019 | $1,553 | $51,000 | $5,900 | $45,100 |
| 2018 | $1,545 | $51,000 | $5,900 | $45,100 |
| 2017 | $1,507 | $51,000 | $5,900 | $45,100 |
| 2016 | $1,459 | $51,000 | $5,900 | $45,100 |
| 2015 | $1,405 | $51,000 | $5,900 | $45,100 |
| 2014 | $1,371 | $51,000 | $5,900 | $45,100 |
Source: Public Records
Map
Nearby Homes