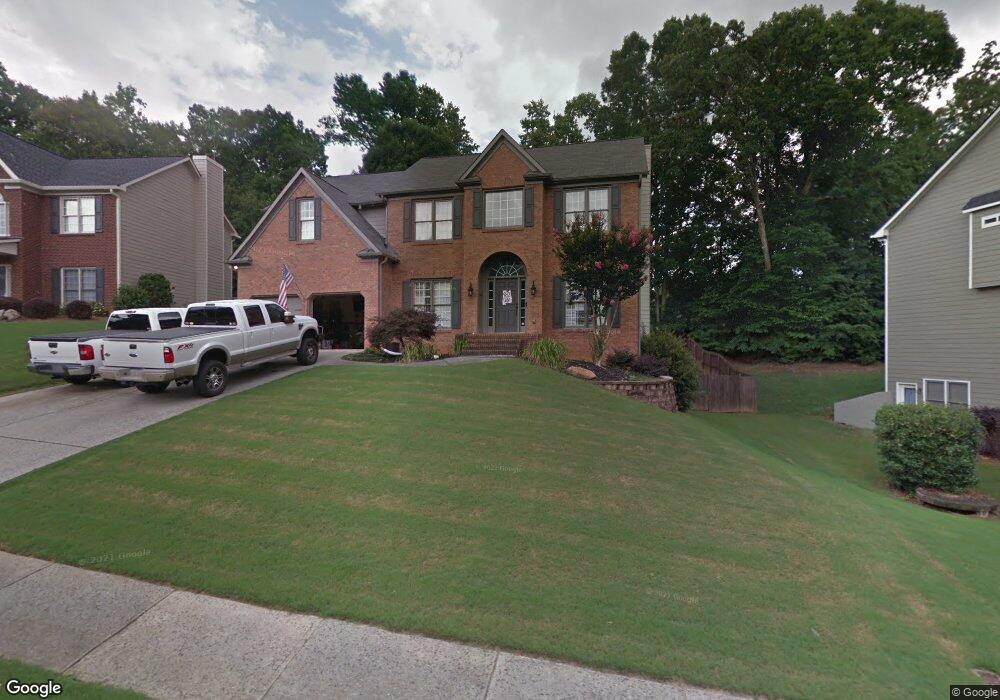
411 Hickory Haven Terrace Unit 5 Suwanee, GA 30024
Estimated Value: $620,498 - $694,000
4
Beds
3
Baths
2,260
Sq Ft
$288/Sq Ft
Est. Value
About This Home
This home is located at 411 Hickory Haven Terrace Unit 5, Suwanee, GA 30024 and is currently estimated at $650,625, approximately $287 per square foot. 411 Hickory Haven Terrace Unit 5 is a home located in Gwinnett County with nearby schools including Suwanee Elementary School, North Gwinnett Middle School, and North Gwinnett High School.
Ownership History
Date
Name
Owned For
Owner Type
Purchase Details
Closed on
Sep 27, 2013
Sold by
Deas Mary Grace
Bought by
Deas William K and Deas Mary Grace
Current Estimated Value
Home Financials for this Owner
Home Financials are based on the most recent Mortgage that was taken out on this home.
Original Mortgage
$221,800
Outstanding Balance
$165,862
Interest Rate
4.53%
Mortgage Type
New Conventional
Estimated Equity
$484,763
Purchase Details
Closed on
Feb 16, 2007
Sold by
Deas William
Bought by
Deas Mary G
Purchase Details
Closed on
Dec 15, 2000
Sold by
O'Dwyer & Assoc Inc
Bought by
Deas William and Deas Mary G
Home Financials for this Owner
Home Financials are based on the most recent Mortgage that was taken out on this home.
Original Mortgage
$184,300
Interest Rate
8.25%
Mortgage Type
New Conventional
Create a Home Valuation Report for This Property
The Home Valuation Report is an in-depth analysis detailing your home's value as well as a comparison with similar homes in the area
Home Values in the Area
Average Home Value in this Area
Purchase History
| Date | Buyer | Sale Price | Title Company |
|---|---|---|---|
| Deas William K | -- | -- | |
| Deas Mary G | -- | -- | |
| Deas William | $230,400 | -- |
Source: Public Records
Mortgage History
| Date | Status | Borrower | Loan Amount |
|---|---|---|---|
| Open | Deas William K | $221,800 | |
| Previous Owner | Deas William | $184,300 |
Source: Public Records
Tax History Compared to Growth
Tax History
| Year | Tax Paid | Tax Assessment Tax Assessment Total Assessment is a certain percentage of the fair market value that is determined by local assessors to be the total taxable value of land and additions on the property. | Land | Improvement |
|---|---|---|---|---|
| 2025 | $7,144 | $243,520 | $44,080 | $199,440 |
| 2024 | $7,183 | $237,360 | $47,200 | $190,160 |
| 2023 | $7,183 | $223,880 | $47,200 | $176,680 |
| 2022 | $6,453 | $203,600 | $40,400 | $163,200 |
| 2021 | $5,431 | $150,240 | $29,720 | $120,520 |
| 2020 | $5,321 | $143,560 | $27,640 | $115,920 |
| 2019 | $5,338 | $143,560 | $27,640 | $115,920 |
| 2018 | $4,919 | $131,320 | $32,000 | $99,320 |
| 2016 | $4,421 | $116,680 | $28,000 | $88,680 |
| 2015 | $4,389 | $114,360 | $27,200 | $87,160 |
| 2014 | $4,414 | $114,360 | $27,200 | $87,160 |
Source: Public Records
Map
Nearby Homes
- 682 Montglade Ct Unit 1
- 665 Roxford Ln Unit 3
- 812 Holly Meadow Dr
- 3612 Brookefall Ct
- 3645 Hickory Branch Trail Unit 1
- 3720 Brookefall Landing
- 515 Morning Creek Ln
- 3811 Roxfield Dr
- 3725 Roxwood Park Dr Unit 1
- 3540 Hickory Branch Trail
- 3740 Crescent Walk Ln
- 407 Vista Lake Dr
- 3720 Crescent Walk Ln
- 3805 Roxwood Park Dr Unit 1
- 3713 Lake Edge Dr
- 3941 Oak Crossing Dr
- 189 Rutlidge Park Ln
- 3998 Oak Crossing Dr NE
- 391 Hickory Haven Terrace Unit 5
- 421 Hickory Haven Terrace Unit 5
- 381 Hickory Haven Terrace
- 3790 Summit Gate Dr Unit 6
- 3810 Summit Gate Dr Unit 6
- 431 Hickory Haven Terrace
- 0 Hickory Haven Terrace Unit 7285487
- 0 Hickory Haven Terrace
- 402 Hickory Haven Terrace
- 371 Hickory Haven Terrace Unit 5
- 412 Hickory Haven Terrace
- 392 Hickory Haven Terrace
- 0 Summit Gate Dr Unit 8621576
- 0 Summit Gate Dr Unit 8571973
- 0 Summit Gate Dr Unit 7541678
- 0 Summit Gate Dr Unit 9077712
- 0 Summit Gate Dr Unit 8942332
- 0 Summit Gate Dr Unit 7293902
- 3820 Summit Gate Dr Unit 6