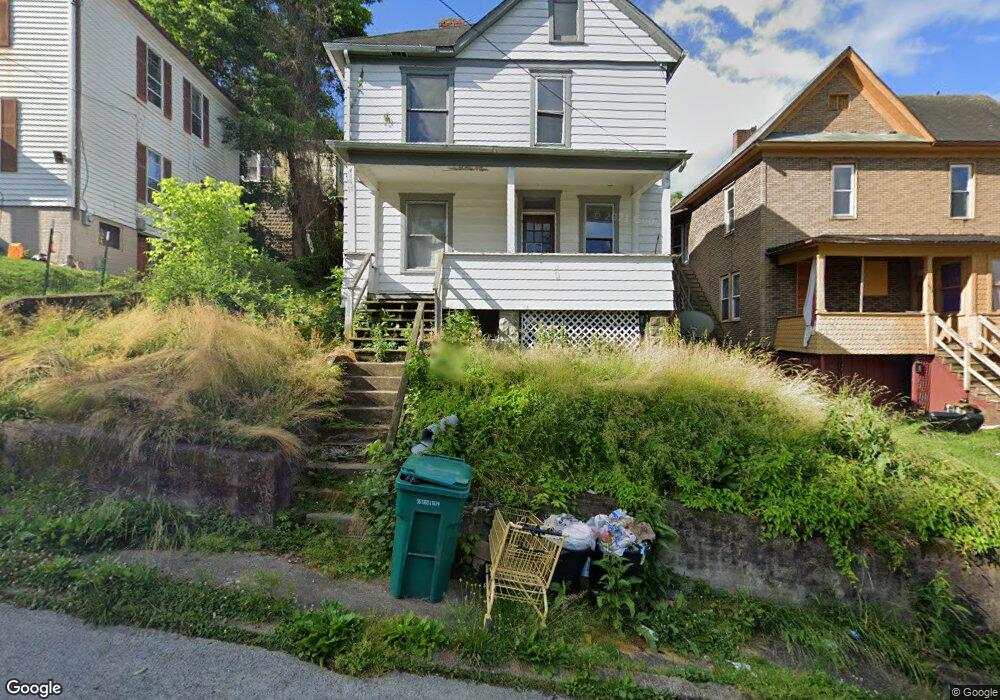
411 High St Clarksburg, WV 26301
Estimated Value: $56,000 - $81,000
3
Beds
2
Baths
1,710
Sq Ft
$42/Sq Ft
Est. Value
About This Home
This home is located at 411 High St, Clarksburg, WV 26301 and is currently estimated at $71,124, approximately $41 per square foot. 411 High St is a home located in Harrison County with nearby schools including St. Mary's Grade School, Emmanuel Christian School, and Notre Dame Middle School and Notre Dame High School.
Ownership History
Date
Name
Owned For
Owner Type
Purchase Details
Closed on
Jan 12, 2024
Sold by
Dancy Matthew J
Bought by
Henderson Holdings Llc
Current Estimated Value
Home Financials for this Owner
Home Financials are based on the most recent Mortgage that was taken out on this home.
Original Mortgage
$70,000
Interest Rate
6.95%
Mortgage Type
Construction
Purchase Details
Closed on
Jul 13, 2015
Sold by
Dickinson K Wade and Dickinson Mary
Bought by
Dancy Matthew J
Create a Home Valuation Report for This Property
The Home Valuation Report is an in-depth analysis detailing your home's value as well as a comparison with similar homes in the area
Home Values in the Area
Average Home Value in this Area
Purchase History
| Date | Buyer | Sale Price | Title Company |
|---|---|---|---|
| Henderson Holdings Llc | $17,000 | None Listed On Document | |
| Dancy Matthew J | $14,000 | None Available |
Source: Public Records
Mortgage History
| Date | Status | Borrower | Loan Amount |
|---|---|---|---|
| Closed | Henderson Holdings Llc | $70,000 |
Source: Public Records
Tax History Compared to Growth
Tax History
| Year | Tax Paid | Tax Assessment Tax Assessment Total Assessment is a certain percentage of the fair market value that is determined by local assessors to be the total taxable value of land and additions on the property. | Land | Improvement |
|---|---|---|---|---|
| 2024 | $806 | $24,660 | $5,940 | $18,720 |
| 2023 | $751 | $23,100 | $5,940 | $17,160 |
| 2022 | $774 | $24,900 | $5,940 | $18,960 |
| 2021 | $759 | $24,660 | $5,940 | $18,720 |
| 2020 | $745 | $24,360 | $5,940 | $18,420 |
| 2019 | $554 | $18,120 | $5,460 | $12,660 |
| 2018 | $547 | $17,940 | $5,460 | $12,480 |
| 2017 | $537 | $17,700 | $5,460 | $12,240 |
| 2016 | $498 | $16,560 | $4,560 | $12,000 |
| 2015 | $491 | $16,260 | $4,560 | $11,700 |
| 2014 | $431 | $14,280 | $2,760 | $11,520 |
Source: Public Records
Map
Nearby Homes
- 11 Davis Place
- 505 S 3rd St
- 342 Lee Ave
- 179 Elliot St
- 0 S 3rd St
- 403 S Chestnut St
- 439 S Chestnut St
- 0 E B Saunders Way
- 614 W Main St
- 512 Jessie St
- 124 N Chestnut St
- 243 1/2 S Maple Ave
- 159 E Main St
- 247 Park Blvd
- 645 Mulberry Ave
- 655/655 1/2 Mulberry Ave
- 312 Clark St
- 735 Mulberry Ave
- 196 Buena Vista Ave
- 227 Carr Ave