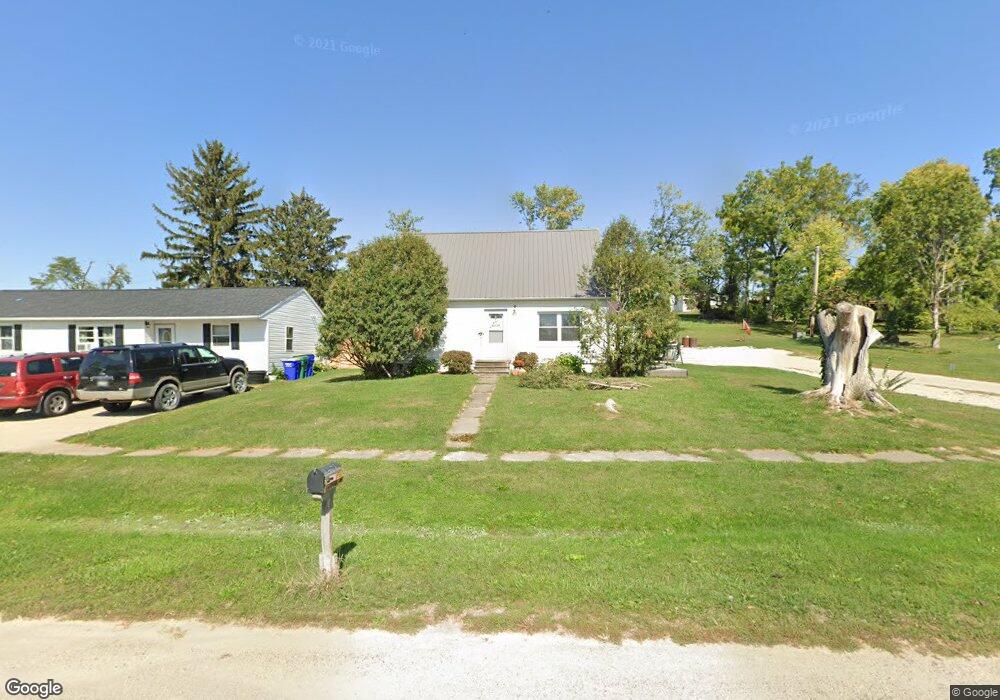
411 Jones St SE Shellsburg, IA 52332
Estimated Value: $137,014 - $176,000
3
Beds
2
Baths
1,037
Sq Ft
$150/Sq Ft
Est. Value
About This Home
This home is located at 411 Jones St SE, Shellsburg, IA 52332 and is currently estimated at $155,504, approximately $149 per square foot. 411 Jones St SE is a home located in Benton County with nearby schools including Shellsburg Elementary School, Vinton-Shellsburg Middle School, and Vinton-Shellsburg High School.
Ownership History
Date
Name
Owned For
Owner Type
Purchase Details
Closed on
Jul 14, 2021
Sold by
Primrose Carroll J and Primrose Ruth Ann
Bought by
Vanderheiden Michael
Current Estimated Value
Home Financials for this Owner
Home Financials are based on the most recent Mortgage that was taken out on this home.
Original Mortgage
$81,000
Outstanding Balance
$73,562
Interest Rate
2.96%
Mortgage Type
New Conventional
Estimated Equity
$81,942
Create a Home Valuation Report for This Property
The Home Valuation Report is an in-depth analysis detailing your home's value as well as a comparison with similar homes in the area
Purchase History
We collect this data history from publicly available records. To have your information removed, we recommend requesting removal directly through your county’s website.
| Date | Buyer | Sale Price | Title Company |
|---|---|---|---|
| Vanderheiden Michael | $90,000 | None Available |
Source: Public Records
Mortgage History
We collect this data history from publicly available records. To have your information removed, we recommend requesting removal directly through your county’s website.
| Date | Status | Borrower | Loan Amount |
|---|---|---|---|
| Open | Vanderheiden Michael | $81,000 |
Source: Public Records
Tax History
| Year | Tax Paid | Tax Assessment Tax Assessment Total Assessment is a certain percentage of the fair market value that is determined by local assessors to be the total taxable value of land and additions on the property. | Land | Improvement |
|---|---|---|---|---|
| 2025 | $2,076 | $123,300 | $24,500 | $98,800 |
| 2024 | $2,076 | $118,400 | $24,500 | $93,900 |
| 2023 | $2,004 | $118,400 | $24,500 | $93,900 |
| 2022 | $1,950 | $100,800 | $19,600 | $81,200 |
| 2021 | $1,950 | $99,300 | $19,600 | $79,700 |
| 2020 | $1,766 | $88,900 | $19,600 | $69,300 |
| 2019 | $1,698 | $88,900 | $19,600 | $69,300 |
| 2018 | $1,634 | $85,600 | $17,400 | $68,200 |
| 2017 | $1,652 | $85,600 | $17,400 | $68,200 |
| 2016 | $1,620 | $82,300 | $16,700 | $65,600 |
| 2015 | $1,620 | $82,300 | $16,700 | $65,600 |
| 2014 | $1,640 | $83,100 | $0 | $0 |
Source: Public Records
Map
Nearby Homes
- 401 Main St NW
- 410 Cottage St NW
- 92 Wildcat Trail SW
- 700 Sunset Blvd
- 804 Fairway Dr
- 301 Wildcat Ct
- 101 Meadow Dr
- 103 Meadow Dr
- 105 Meadow Dr
- 3387 64th St
- 0 31st Ave
- 6172 33rd Avenue Dr
- 3386 64th St
- 2791 Creekview Trail
- 2787 Creekview Trail
- 4595 Meadow Creek Dr
- 926 Indigo Dr
- 736 Indigo Dr
- 827 Indigo Dr
- 0 Benton Linn Rd
- 409 Jones St SE
- 401 Jones St SE
- 400 Summer St SE
- 501 Jones St SE
- 404 Jones St SE
- 402 Jones St SE
- 406 Jones St SE
- 400 Jones St SE
- 410 Main St E
- 500 Jones St SE
- 502 Main St SE
- 307 Jones St SE
- 102 Homer St SE
- 505 Jones St SE
- 103 Summer St
- 101 Homer St SE
- 506 Jones St SE
- 514 Jones St SE
- 304 Jones St SE
- 104 Homer St SE
Your Personal Tour Guide
Ask me questions while you tour the home.