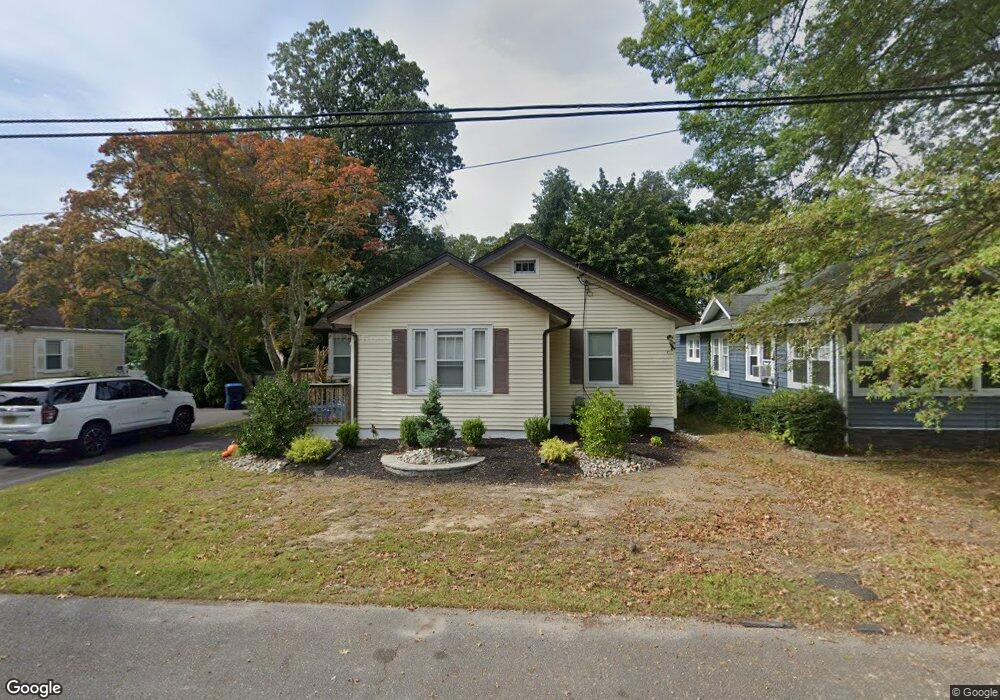
411 Locust St Neptune, NJ 07753
Estimated Value: $478,000 - $554,000
3
Beds
2
Baths
1,240
Sq Ft
$404/Sq Ft
Est. Value
About This Home
This home is located at 411 Locust St, Neptune, NJ 07753 and is currently estimated at $501,318, approximately $404 per square foot. 411 Locust St is a home located in Monmouth County with nearby schools including Neptune High School.
Ownership History
Date
Name
Owned For
Owner Type
Purchase Details
Closed on
Apr 26, 2022
Sold by
Luther Jr David B
Bought by
Palagonia Robert
Current Estimated Value
Purchase Details
Closed on
Jun 30, 2006
Sold by
Luther David B
Bought by
Luther David B
Home Financials for this Owner
Home Financials are based on the most recent Mortgage that was taken out on this home.
Original Mortgage
$243,750
Interest Rate
7.25%
Mortgage Type
Adjustable Rate Mortgage/ARM
Create a Home Valuation Report for This Property
The Home Valuation Report is an in-depth analysis detailing your home's value as well as a comparison with similar homes in the area
Home Values in the Area
Average Home Value in this Area
Purchase History
| Date | Buyer | Sale Price | Title Company |
|---|---|---|---|
| Palagonia Robert | $180,000 | Westcor Land Title | |
| Palagonia Robert | $180,000 | Westcor Land Title | |
| Luther David B | $325,000 | -- |
Source: Public Records
Mortgage History
| Date | Status | Borrower | Loan Amount |
|---|---|---|---|
| Previous Owner | Luther David B | $243,750 |
Source: Public Records
Tax History Compared to Growth
Tax History
| Year | Tax Paid | Tax Assessment Tax Assessment Total Assessment is a certain percentage of the fair market value that is determined by local assessors to be the total taxable value of land and additions on the property. | Land | Improvement |
|---|---|---|---|---|
| 2025 | $6,939 | $433,800 | $259,800 | $174,000 |
| 2024 | $6,012 | $396,300 | $225,500 | $170,800 |
| 2023 | $6,012 | $332,900 | $166,100 | $166,800 |
| 2022 | $5,733 | $320,800 | $162,000 | $158,800 |
| 2021 | $5,733 | $271,300 | $150,400 | $120,900 |
| 2020 | $5,344 | $252,300 | $137,800 | $114,500 |
| 2019 | $5,122 | $238,800 | $131,400 | $107,400 |
| 2018 | $4,995 | $230,200 | $123,600 | $106,600 |
| 2017 | $4,895 | $216,700 | $118,000 | $98,700 |
| 2016 | $4,648 | $205,200 | $108,000 | $97,200 |
| 2015 | $4,338 | $194,800 | $100,000 | $94,800 |
| 2014 | $4,906 | $181,100 | $90,000 | $91,100 |
Source: Public Records
Map
Nearby Homes