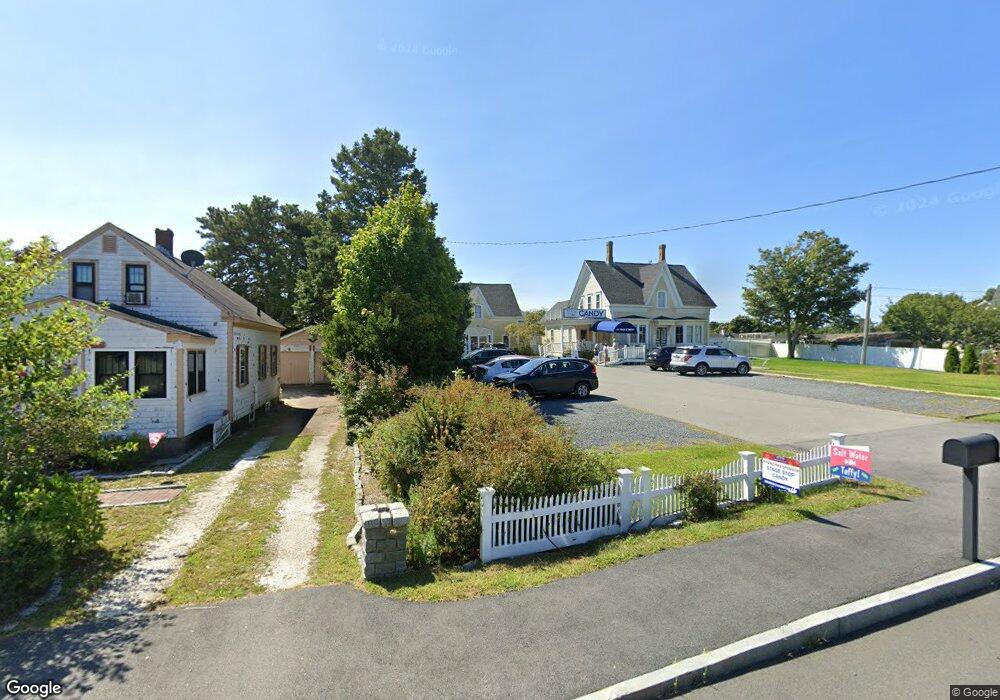
411 Main St Dennis Port, MA 2639
Dennis Port NeighborhoodEstimated Value: $1,117,098
3
Beds
--
Bath
6,403
Sq Ft
$174/Sq Ft
Est. Value
About This Home
This home is located at 411 Main St, Dennis Port, MA 2639 and is currently estimated at $1,117,098, approximately $174 per square foot. 411 Main St is a home located in Barnstable County with nearby schools including Dennis-Yarmouth Regional High School and St. Pius X. School.
Ownership History
Date
Name
Owned For
Owner Type
Purchase Details
Closed on
Jul 29, 2020
Sold by
Hebert Donna M and Hebert Raymond L
Bought by
Woodleigh South Llc
Current Estimated Value
Home Financials for this Owner
Home Financials are based on the most recent Mortgage that was taken out on this home.
Original Mortgage
$332,250
Outstanding Balance
$293,960
Interest Rate
3.1%
Mortgage Type
New Conventional
Estimated Equity
$823,138
Purchase Details
Closed on
Dec 28, 1992
Sold by
Stavros John
Bought by
Fishler Mary Shiverick and Fishler Bennett
Create a Home Valuation Report for This Property
The Home Valuation Report is an in-depth analysis detailing your home's value as well as a comparison with similar homes in the area
Home Values in the Area
Average Home Value in this Area
Purchase History
| Date | Buyer | Sale Price | Title Company |
|---|---|---|---|
| Woodleigh South Llc | $664,500 | None Available | |
| Fishler Mary Shiverick | $135,000 | -- |
Source: Public Records
Mortgage History
| Date | Status | Borrower | Loan Amount |
|---|---|---|---|
| Open | Woodleigh South Llc | $332,250 |
Source: Public Records
Tax History Compared to Growth
Tax History
| Year | Tax Paid | Tax Assessment Tax Assessment Total Assessment is a certain percentage of the fair market value that is determined by local assessors to be the total taxable value of land and additions on the property. | Land | Improvement |
|---|---|---|---|---|
| 2025 | $3,624 | $836,900 | $367,800 | $469,100 |
| 2024 | $3,343 | $761,400 | $354,400 | $407,000 |
| 2023 | $3,385 | $724,900 | $337,500 | $387,400 |
| 2022 | $3,682 | $657,500 | $291,900 | $365,600 |
| 2021 | $4,099 | $679,700 | $307,800 | $371,900 |
| 2020 | $4,053 | $664,500 | $301,600 | $362,900 |
| 2019 | $4,077 | $660,700 | $301,600 | $359,100 |
| 2018 | $4,144 | $653,700 | $301,600 | $352,100 |
| 2017 | $4,020 | $653,700 | $301,600 | $352,100 |
| 2016 | $5,364 | $821,500 | $301,600 | $519,900 |
| 2015 | $5,526 | $863,400 | $301,600 | $561,800 |
| 2014 | $4,603 | $724,900 | $301,600 | $423,300 |
Source: Public Records
Map
Nearby Homes
- 10 Candlewood Ln Unit 2-1
- 12 Candlewood Ln Unit 2-9
- 12 Cross St
- 72 Bassett Ln
- 268 Main St
- 9 Country Ln
- 166 Upper County Rd Unit 1-4
- 159 Center St Unit 22
- 221 Upper County Rd Unit 2A
- 221 Upper County Rd Unit 2A
- 22 Wixon Rd
- 47 Telegraph Rd Unit 1
- 26 Manning Rd
- 78 Upper County Rd Unit A&B
- 78 Upper County Rd
- 31 Easy St
- 102 Sea St
- 22 Ferncliff Rd
- 125 Main St Unit 3
- 4 Coffey Ln
- 419 Main St
- 425 Main St
- 425 Main (Route 28) St
- 56 Center St
- 56 Center St Unit 1-2
- 56 Center St Unit 2-4
- 56 Center St Unit 2-8
- 56 Center St Unit 2-7
- 56 Center St Unit 2-6
- 56 Center St Unit 2-2
- 56 Center St Unit 1-03
- 56 Center St Unit 1-8
- 56 Center St Unit 1-7
- 56 Center St Unit 1-1
- 56 Center St Unit 1-6
- 56 Center St Unit 1-07
- 56 Center St Unit 2-5
- 56 Center St Unit U1-02
- 56 Center St Unit 1-4
- 56 Center St Unit 1-3