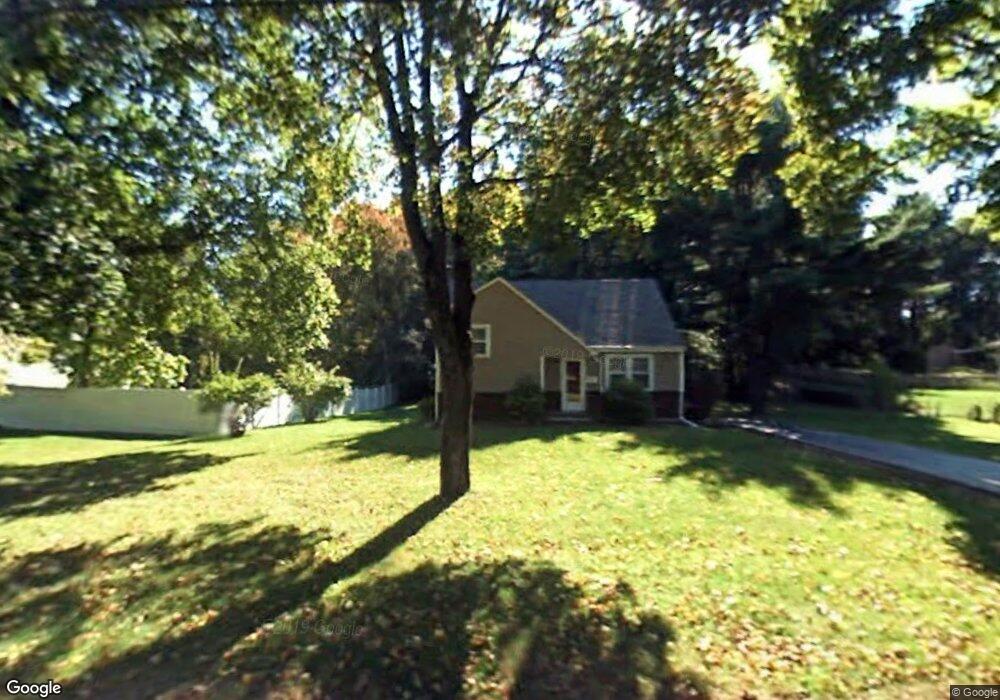
411 Matfield St West Bridgewater, MA 02379
Estimated Value: $555,000 - $631,000
3
Beds
1
Bath
1,176
Sq Ft
$501/Sq Ft
Est. Value
About This Home
This home is located at 411 Matfield St, West Bridgewater, MA 02379 and is currently estimated at $589,712, approximately $501 per square foot. 411 Matfield St is a home located in Plymouth County with nearby schools including Spring Street Elementary School, Howard Elementary School, and Rose L. MacDonald Elementary School.
Ownership History
Date
Name
Owned For
Owner Type
Purchase Details
Closed on
Oct 7, 2011
Sold by
Clooney Robert F and Clooney Raymond T
Bought by
Garfield Glen A
Current Estimated Value
Home Financials for this Owner
Home Financials are based on the most recent Mortgage that was taken out on this home.
Original Mortgage
$168,800
Outstanding Balance
$114,571
Interest Rate
4%
Mortgage Type
Purchase Money Mortgage
Estimated Equity
$475,141
Create a Home Valuation Report for This Property
The Home Valuation Report is an in-depth analysis detailing your home's value as well as a comparison with similar homes in the area
Home Values in the Area
Average Home Value in this Area
Purchase History
| Date | Buyer | Sale Price | Title Company |
|---|---|---|---|
| Garfield Glen A | $220,450 | -- |
Source: Public Records
Mortgage History
| Date | Status | Borrower | Loan Amount |
|---|---|---|---|
| Open | Garfield Glen A | $168,800 |
Source: Public Records
Tax History Compared to Growth
Tax History
| Year | Tax Paid | Tax Assessment Tax Assessment Total Assessment is a certain percentage of the fair market value that is determined by local assessors to be the total taxable value of land and additions on the property. | Land | Improvement |
|---|---|---|---|---|
| 2025 | $6,739 | $493,000 | $241,500 | $251,500 |
| 2024 | $6,277 | $443,000 | $219,800 | $223,200 |
| 2023 | $5,791 | $376,800 | $190,100 | $186,700 |
| 2022 | $5,542 | $341,700 | $179,200 | $162,500 |
| 2021 | $2,247 | $329,800 | $179,200 | $150,600 |
| 2020 | $2,667 | $329,800 | $179,200 | $150,600 |
| 2019 | $4,802 | $290,500 | $179,200 | $111,300 |
| 2018 | $10,837 | $276,600 | $170,500 | $106,100 |
| 2017 | $4,585 | $258,600 | $155,200 | $103,400 |
| 2016 | $4,466 | $248,100 | $144,700 | $103,400 |
| 2015 | $4,221 | $237,000 | $144,700 | $92,300 |
| 2014 | $3,773 | $228,800 | $144,700 | $84,100 |
Source: Public Records
Map
Nearby Homes
- 417 Matfield St
- 393 Matfield St
- 400 Matfield St
- 390 Matfield St
- 416 Matfield St
- 385 Matfield St
- 382 Matfield St
- 9 Arborview Terrace
- 378 Matfield St
- 378 Matfield St Unit 2
- 394 Matfield St
- 7 Arborview Terrace
- 131 Belmont St
- 10 Arborview Terrace
- 451 Matfield St
- 357 Matfield St
- 8 Arborview Terrace
- 448 Matfield St
- 448 Matfield St Unit 1
- 355 Matfield St