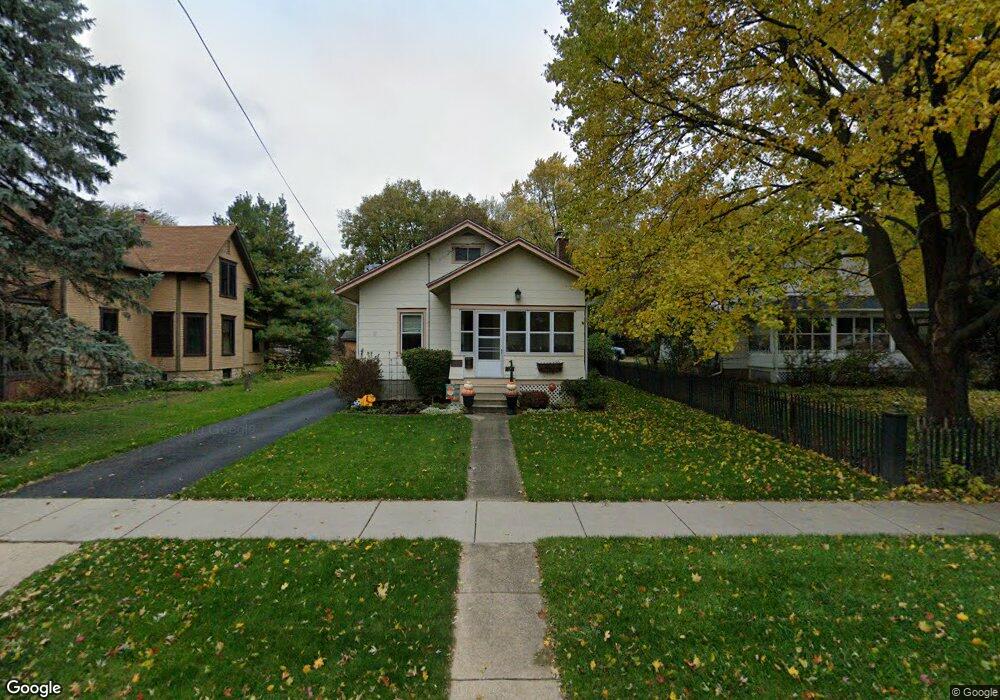
411 Mckee St Batavia, IL 60510
Northwest Batavia NeighborhoodEstimated Value: $279,375 - $368,000
3
Beds
1
Bath
995
Sq Ft
$333/Sq Ft
Est. Value
About This Home
This home is located at 411 Mckee St, Batavia, IL 60510 and is currently estimated at $331,594, approximately $333 per square foot. 411 Mckee St is a home located in Kane County with nearby schools including H C Storm Elementary School, Sam Rotolo Middle School, and Batavia Sr High School.
Ownership History
Date
Name
Owned For
Owner Type
Purchase Details
Closed on
Mar 13, 2021
Sold by
Monty Hanson Kelly
Bought by
Lee Kelly
Current Estimated Value
Home Financials for this Owner
Home Financials are based on the most recent Mortgage that was taken out on this home.
Original Mortgage
$181,000
Outstanding Balance
$133,276
Interest Rate
2.37%
Mortgage Type
New Conventional
Estimated Equity
$198,319
Purchase Details
Closed on
Sep 12, 2007
Sold by
Sundahl Thomas and Sundahl Patricia
Bought by
Monty Hanson Kelly
Home Financials for this Owner
Home Financials are based on the most recent Mortgage that was taken out on this home.
Original Mortgage
$236,500
Interest Rate
6.71%
Mortgage Type
Purchase Money Mortgage
Purchase Details
Closed on
Jan 30, 2007
Sold by
Adelman Christine
Bought by
Sundahl Thomas and Sundahl Patricia
Home Financials for this Owner
Home Financials are based on the most recent Mortgage that was taken out on this home.
Original Mortgage
$160,000
Interest Rate
6.19%
Mortgage Type
New Conventional
Create a Home Valuation Report for This Property
The Home Valuation Report is an in-depth analysis detailing your home's value as well as a comparison with similar homes in the area
Home Values in the Area
Average Home Value in this Area
Purchase History
We collect this data history from publicly available records. To have your information removed, we recommend requesting removal directly through your county’s website.
| Date | Buyer | Sale Price | Title Company |
|---|---|---|---|
| Lee Kelly | -- | Attorney | |
| Monty Hanson Kelly | $262,500 | Chicago Title Insurance Co | |
| Sundahl Thomas | $200,000 | Chicago Title Insurance Co |
Source: Public Records
Mortgage History
We collect this data history from publicly available records. To have your information removed, we recommend requesting removal directly through your county’s website.
| Date | Status | Borrower | Loan Amount |
|---|---|---|---|
| Open | Lee Kelly | $181,000 | |
| Previous Owner | Monty Hanson Kelly | $236,500 | |
| Previous Owner | Sundahl Thomas | $160,000 |
Source: Public Records
Tax History
| Year | Tax Paid | Tax Assessment Tax Assessment Total Assessment is a certain percentage of the fair market value that is determined by local assessors to be the total taxable value of land and additions on the property. | Land | Improvement |
|---|---|---|---|---|
| 2024 | $4,652 | $66,838 | $15,951 | $50,887 |
| 2023 | $4,519 | $60,662 | $14,477 | $46,185 |
| 2022 | $4,427 | $56,694 | $13,530 | $43,164 |
| 2021 | $4,235 | $53,769 | $12,832 | $40,937 |
| 2020 | $4,125 | $52,735 | $12,585 | $40,150 |
| 2019 | $4,046 | $50,868 | $12,139 | $38,729 |
| 2018 | $3,874 | $48,931 | $11,677 | $37,254 |
| 2017 | $3,770 | $47,318 | $11,292 | $36,026 |
| 2016 | $3,680 | $45,940 | $10,963 | $34,977 |
| 2015 | -- | $44,894 | $10,713 | $34,181 |
| 2014 | -- | $43,481 | $10,376 | $33,105 |
| 2013 | -- | $52,791 | $12,718 | $40,073 |
Source: Public Records
Map
Nearby Homes
- 211 N Batavia Ave
- 511 Houston St
- 16 S Harrison St
- 107 N Mallory Ave
- 109 N Van Nortwick Ave
- 966 Houston St
- 345 Main St
- 974 Houston St
- 214 Furnas Dr
- 230 Furnas Dr
- 615 Elm St
- 1676 Carlstedt Dr
- 2001 Stuttle Rd
- 304 S Water St
- 327 S Jackson St
- 1067 Houston St Unit 89004
- 210 Weirich Way Unit 88003
- 803 N Washington Ave
- 627 Park St
- 73 Weirich Way Unit 78003
Your Personal Tour Guide
Ask me questions while you tour the home.