Estimated Value: $478,000 - $537,000
4
Beds
3
Baths
2,716
Sq Ft
$183/Sq Ft
Est. Value
About This Home
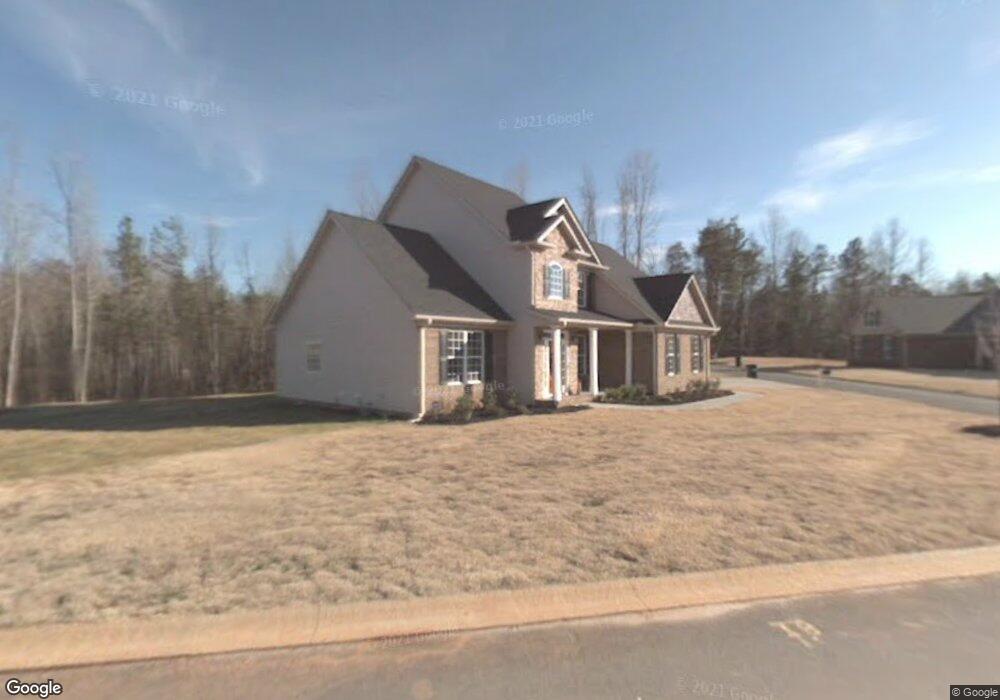
This home is located at 411 Mellow Way, Greer, SC 29651 and is currently estimated at $496,006, approximately $182 per square foot. 411 Mellow Way is a home located in Greenville County with nearby schools including Skyland Elementary School, Greer Middle School, and Greer High School.
Ownership History
Date
Name
Owned For
Owner Type
Purchase Details
Closed on
Jan 4, 2020
Sold by
Pcreumley Lynn and Jones Lynn P
Bought by
Stwbrs Dale E and Black Dale E
Current Estimated Value
Purchase Details
Closed on
Apr 12, 2007
Sold by
Isaacson Caleb
Bought by
Crumley Lynn P
Home Financials for this Owner
Home Financials are based on the most recent Mortgage that was taken out on this home.
Original Mortgage
$165,000
Outstanding Balance
$97,772
Interest Rate
6.15%
Mortgage Type
Purchase Money Mortgage
Estimated Equity
$398,234
Purchase Details
Closed on
Jan 23, 2007
Sold by
Midland Inc
Bought by
Isaacson Caleb
Home Financials for this Owner
Home Financials are based on the most recent Mortgage that was taken out on this home.
Original Mortgage
$191,200
Interest Rate
6.14%
Mortgage Type
Purchase Money Mortgage
Create a Home Valuation Report for This Property
The Home Valuation Report is an in-depth analysis detailing your home's value as well as a comparison with similar homes in the area
Home Values in the Area
Average Home Value in this Area
Purchase History
| Date | Buyer | Sale Price | Title Company |
|---|---|---|---|
| Stwbrs Dale E | -- | None Available | |
| Crumley Lynn P | $240,710 | None Available | |
| Isaacson Caleb | $68,000 | None Available |
Source: Public Records
Mortgage History
| Date | Status | Borrower | Loan Amount |
|---|---|---|---|
| Open | Crumley Lynn P | $165,000 | |
| Previous Owner | Isaacson Caleb | $191,200 |
Source: Public Records
Tax History
| Year | Tax Paid | Tax Assessment Tax Assessment Total Assessment is a certain percentage of the fair market value that is determined by local assessors to be the total taxable value of land and additions on the property. | Land | Improvement |
|---|---|---|---|---|
| 2025 | $1,505 | $12,100 | $2,620 | $9,480 |
| 2024 | $1,505 | $10,520 | $1,480 | $9,040 |
| 2023 | $1,411 | $10,520 | $1,480 | $9,040 |
| 2022 | $1,618 | $10,520 | $1,480 | $9,040 |
| 2021 | $1,602 | $10,520 | $1,480 | $9,040 |
| 2020 | $1,513 | $9,400 | $1,280 | $8,120 |
| 2019 | $1,503 | $9,400 | $1,280 | $8,120 |
| 2018 | $1,499 | $9,400 | $1,280 | $8,120 |
| 2017 | $1,463 | $9,400 | $1,280 | $8,120 |
| 2016 | $1,405 | $234,940 | $32,000 | $202,940 |
| 2015 | $1,405 | $234,940 | $32,000 | $202,940 |
| 2014 | $1,394 | $234,290 | $36,500 | $197,790 |
Source: Public Records
Map
Nearby Homes
- 50 Lebanon Ct
- 3952 Jordan Rd
- 2 Exodus Way
- 203 Claridge Way
- 208 Claridge Way
- 210 Claridge Way
- 9 Adara Ct
- 495 Mount Lebanon Church Rd
- 3505 Ballenger Rd
- 10 Chasie Ln
- 104 Josh Ct
- 581 Flynn Rd
- 0 Jordan Rd Unit SPN331464
- 0 Jordan Rd Unit 1576355
- 225 Josh Ct
- 25 Natalie Ct
- 505 Brightfield Ln
- 701 Aspen Dr
- 4525 Babb Rd
- 525 Sapling Gap Rd
- 5 San Bruno Ct
- 433 Yellow Rox Dr
- 9 San Bruno Ct
- 501 Mellow Way
- 416 Mellow Way
- 410 Mellow Way
- 420 Mellow Way
- 414 Mellow Way
- 6 San Bruno Ct
- 200 Fox Farm Way
- 204 Fox Farm Way
- 500 Mellow Way
- 15 San Bruno Ct
- 10 San Bruno Ct
- 504 Mellow Way
- 208 Fox Farm Way
- 505 Mellow Way
- 19 San Bruno Ct
- 140 Fox Farm Way
- 14 San Bruno Ct
Your Personal Tour Guide
Ask me questions while you tour the home.