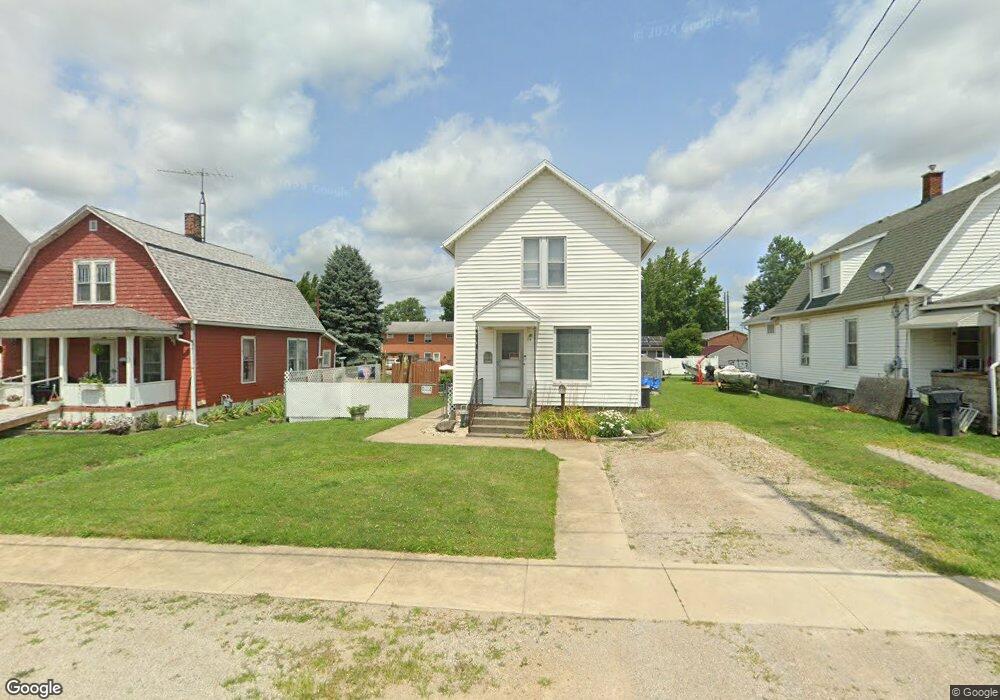
411 Moore Ave Bellevue, OH 44811
Estimated Value: $120,411 - $147,000
2
Beds
2
Baths
1,140
Sq Ft
$116/Sq Ft
Est. Value
About This Home
This home is located at 411 Moore Ave, Bellevue, OH 44811 and is currently estimated at $132,353, approximately $116 per square foot. 411 Moore Ave is a home located in Huron County with nearby schools including Bellevue Elementary School, Bellevue Middle School, and Bellevue High School.
Ownership History
Date
Name
Owned For
Owner Type
Purchase Details
Closed on
May 31, 2017
Sold by
Black Tammy A and Black James L
Bought by
Black Tammy A and Black Freddy L
Current Estimated Value
Purchase Details
Closed on
Aug 25, 2003
Bought by
Black Tammy A and Black James L
Purchase Details
Closed on
Jul 10, 2002
Sold by
Burr Edward
Bought by
White Randolph J and Buurma Laura J
Home Financials for this Owner
Home Financials are based on the most recent Mortgage that was taken out on this home.
Original Mortgage
$65,200
Outstanding Balance
$26,775
Interest Rate
6.82%
Mortgage Type
New Conventional
Estimated Equity
$105,578
Purchase Details
Closed on
Sep 17, 1996
Bought by
Slane Ann C Aka Amber C
Purchase Details
Closed on
May 25, 1988
Bought by
Burr Lynn A
Create a Home Valuation Report for This Property
The Home Valuation Report is an in-depth analysis detailing your home's value as well as a comparison with similar homes in the area
Home Values in the Area
Average Home Value in this Area
Purchase History
| Date | Buyer | Sale Price | Title Company |
|---|---|---|---|
| Black Tammy A | -- | 1St American | |
| Black Tammy A | $69,500 | -- | |
| White Randolph J | $63,900 | -- | |
| Slane Ann C Aka Amber C | -- | -- | |
| Burr Lynn A | -- | -- |
Source: Public Records
Mortgage History
| Date | Status | Borrower | Loan Amount |
|---|---|---|---|
| Open | White Randolph J | $65,200 |
Source: Public Records
Tax History
| Year | Tax Paid | Tax Assessment Tax Assessment Total Assessment is a certain percentage of the fair market value that is determined by local assessors to be the total taxable value of land and additions on the property. | Land | Improvement |
|---|---|---|---|---|
| 2024 | $1,034 | $25,450 | $5,490 | $19,960 |
| 2023 | $1,035 | $20,610 | $4,120 | $16,490 |
| 2022 | $888 | $20,610 | $4,120 | $16,490 |
| 2021 | $896 | $20,610 | $4,120 | $16,490 |
| 2020 | $868 | $18,870 | $3,430 | $15,440 |
| 2019 | $856 | $18,870 | $3,430 | $15,440 |
| 2018 | $844 | $18,870 | $3,430 | $15,440 |
| 2017 | $676 | $15,500 | $2,930 | $12,570 |
| 2016 | $659 | $15,500 | $2,930 | $12,570 |
| 2015 | $677 | $15,580 | $2,940 | $12,640 |
| 2014 | $670 | $14,950 | $2,940 | $12,010 |
| 2013 | $662 | $14,950 | $2,940 | $12,010 |
Source: Public Records
Map
Nearby Homes
- 432 High St
- 303 Moore Ave
- 206 Wood St
- 183 Sheffield St
- 308 E Center St
- 221 Broad St
- 408 W Main St
- 0 St Rt 4 - B
- 135 Attwood Terrace
- 128 East St
- 132 Hamilton St
- 209 Pleasant St
- 140 Hobson St
- 400 Southwest St
- 0 Oakwood Dr
- 100 Winfield Ct
- 140 Crystal Ct
- 630 Gardner St
- 0 County Road 308
- 111 Flat Rock Rd Unit 34
Your Personal Tour Guide
Ask me questions while you tour the home.