Estimated Value: $404,946 - $585,000
4
Beds
3
Baths
2,319
Sq Ft
$212/Sq Ft
Est. Value
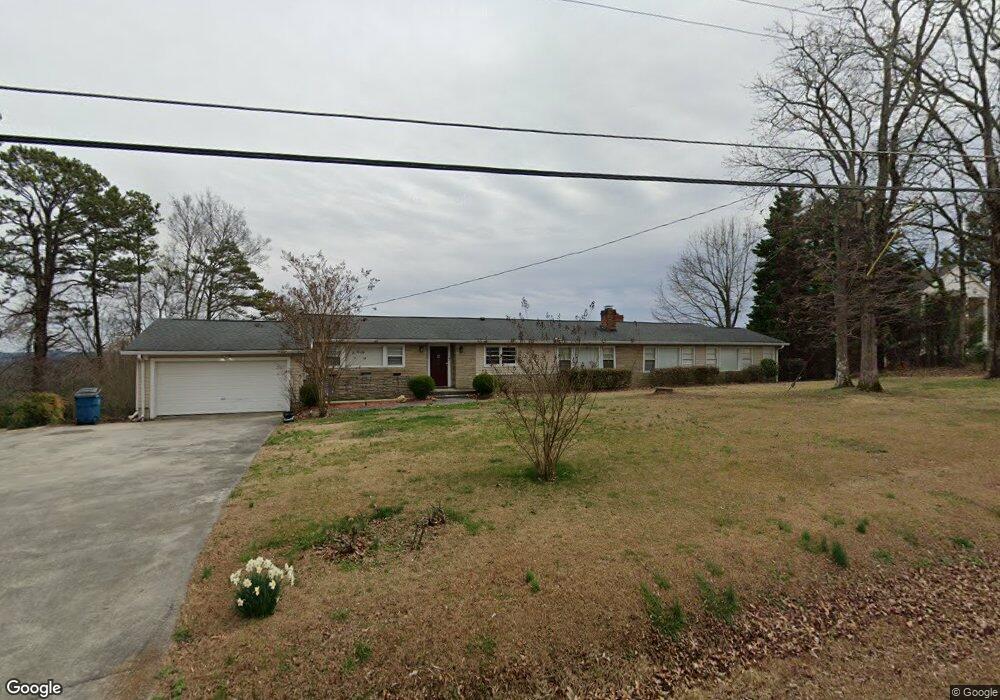
About This Home
This home is located at 411 Mt Alto Rd SW, Rome, GA 30165 and is currently estimated at $490,487, approximately $211 per square foot. 411 Mt Alto Rd SW is a home located in Floyd County with nearby schools including Coosa Middle School and Coosa High School.
Ownership History
Date
Name
Owned For
Owner Type
Purchase Details
Closed on
Dec 4, 2017
Sold by
Kasahara Yoshinori
Bought by
Kasahara Yoshinori and Kasahara Susanne
Current Estimated Value
Purchase Details
Closed on
Jun 29, 2016
Sold by
Manis Diane L
Bought by
Kasahara Yoshinori
Home Financials for this Owner
Home Financials are based on the most recent Mortgage that was taken out on this home.
Original Mortgage
$217,880
Interest Rate
3.75%
Mortgage Type
FHA
Purchase Details
Closed on
Mar 8, 2013
Sold by
Knight Terry Lynn
Bought by
Manis Diane L
Purchase Details
Closed on
Jul 27, 2011
Sold by
Knight William Harley
Bought by
Knight Terry Lynn
Purchase Details
Closed on
Sep 3, 1985
Sold by
R
Bought by
Knight William H
Purchase Details
Closed on
Jun 1, 1982
Sold by
Knight William H
Bought by
Knight William H and Knight Bertis
Purchase Details
Closed on
Oct 31, 1969
Sold by
Reeves S B
Bought by
Knight William H
Purchase Details
Closed on
Jan 1, 1956
Bought by
Reeves S B
Create a Home Valuation Report for This Property
The Home Valuation Report is an in-depth analysis detailing your home's value as well as a comparison with similar homes in the area
Home Values in the Area
Average Home Value in this Area
Purchase History
| Date | Buyer | Sale Price | Title Company |
|---|---|---|---|
| Kasahara Yoshinori | -- | -- | |
| Kasahara Yoshinori | $221,900 | -- | |
| Manis Diane L | $144,000 | -- | |
| Knight Terry Lynn | -- | -- | |
| Knight William H | -- | -- | |
| Knight William H | -- | -- | |
| Knight William H | $33,000 | -- | |
| Reeves S B | -- | -- |
Source: Public Records
Mortgage History
| Date | Status | Borrower | Loan Amount |
|---|---|---|---|
| Previous Owner | Kasahara Yoshinori | $217,880 |
Source: Public Records
Tax History Compared to Growth
Tax History
| Year | Tax Paid | Tax Assessment Tax Assessment Total Assessment is a certain percentage of the fair market value that is determined by local assessors to be the total taxable value of land and additions on the property. | Land | Improvement |
|---|---|---|---|---|
| 2024 | $3,006 | $129,351 | $25,360 | $103,991 |
| 2023 | $3,021 | $124,646 | $22,543 | $102,103 |
| 2022 | $2,735 | $106,707 | $18,786 | $87,921 |
| 2021 | $2,661 | $100,140 | $18,786 | $81,354 |
| 2020 | $2,546 | $92,726 | $14,089 | $78,637 |
| 2019 | $2,353 | $83,765 | $14,089 | $69,676 |
| 2018 | $2,306 | $80,987 | $14,089 | $66,898 |
| 2017 | $2,257 | $78,034 | $14,089 | $63,945 |
| 2016 | $1,849 | $60,600 | $16,000 | $44,600 |
| 2015 | $1,915 | $60,600 | $16,000 | $44,600 |
| 2014 | $1,915 | $60,600 | $16,000 | $44,600 |
Source: Public Records
Map
Nearby Homes
- 202 Green View Rd SW
- 0 Hidden Ridge Dr Unit 10556470
- 0 Hidden Ridge Dr Unit 10343706
- 0 Hidden Ridge Dr Unit 10343701
- 0 Hidden Ridge Dr Unit 10343700
- 0 Hidden Ridge Dr Unit 10343696
- 0 Hidden Ridge Dr Unit 10343694
- 0 Hidden Ridge Dr Unit 10343693
- 0 Hidden Ridge Dr Unit 10343689
- 0 Hidden Ridge Dr Unit 10343688
- 0 Hidden Ridge Dr Unit 10343685
- 0 Hidden Ridge Dr Unit 10343680
- 0 Hidden Ridge Dr Unit 10343676
- 11 Brow Rd SW
- 5 Andrea Ct SW
- 28 Crestwood Dr SW
- 20 Pine Valley Rd SW
- 0 Featherston Rd SW Unit 10512723
- 0 Featherston Rd SW Unit 13890394
- 27 Bluff Mountain Dr SW
- 411 Mount Alto Rd SW
- 409 Mount Alto Rd SW
- 412 Mount Alto Rd SW
- 408 Mount Alto Rd SW
- 408 Mount Alto Rd SW
- 407 Mount Alto Rd SW
- 417 Mount Alto Rd SW
- 405 Mount Alto Rd SW
- 422 Mt Alto Rd
- 422 Mount Alto Rd SW
- 419 Mount Alto Rd SW
- 421 Mount Alto Rd SW
- 365 Mount Alto Rd SW
- 365 Mt Alto Rd
- 424 Mount Alto Rd SW
- 418 Mount Alto Rd SW
- 360 Mount Alto Rd SW
- 363 Mount Alto Rd SW Unit 2
- 363 Mount Alto Rd SW
- 363 Mt Alto Rd