Estimated Value: $122,022 - $180,000
3
Beds
2
Baths
875
Sq Ft
$174/Sq Ft
Est. Value
About This Home
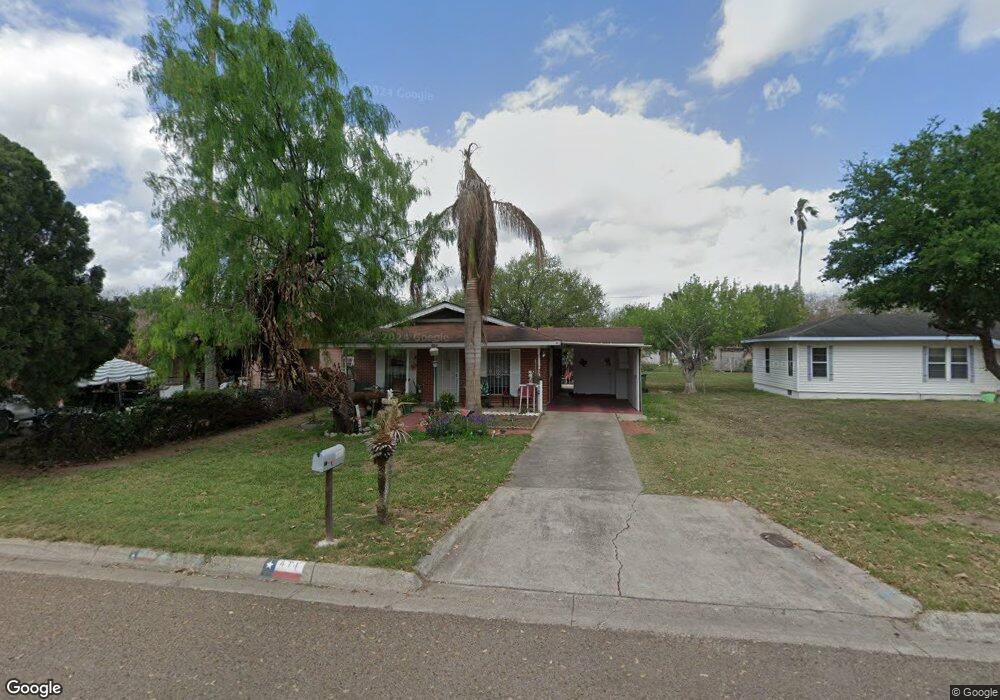
This home is located at 411 N 12th St, Donna, TX 78537 and is currently estimated at $152,506, approximately $174 per square foot. 411 N 12th St is a home located in Hidalgo County with nearby schools including Le Noir Elementary School, W.A. Todd Middle School, and Donna High School.
Ownership History
Date
Name
Owned For
Owner Type
Purchase Details
Closed on
Feb 3, 2012
Sold by
Castillo Margarito and Castillo Irene
Bought by
Castillo Margarito and Castillo Mary
Current Estimated Value
Purchase Details
Closed on
Feb 1, 2007
Sold by
Castillo Margarito and Castillo Mary
Bought by
Castillo Margarito
Home Financials for this Owner
Home Financials are based on the most recent Mortgage that was taken out on this home.
Original Mortgage
$17,000
Outstanding Balance
$10,199
Interest Rate
6.19%
Mortgage Type
Purchase Money Mortgage
Estimated Equity
$142,307
Create a Home Valuation Report for This Property
The Home Valuation Report is an in-depth analysis detailing your home's value as well as a comparison with similar homes in the area
Home Values in the Area
Average Home Value in this Area
Purchase History
| Date | Buyer | Sale Price | Title Company |
|---|---|---|---|
| Castillo Margarito | -- | None Available | |
| Castillo Margarito | -- | Security Land Title Co |
Source: Public Records
Mortgage History
| Date | Status | Borrower | Loan Amount |
|---|---|---|---|
| Open | Castillo Margarito | $17,000 |
Source: Public Records
Tax History Compared to Growth
Tax History
| Year | Tax Paid | Tax Assessment Tax Assessment Total Assessment is a certain percentage of the fair market value that is determined by local assessors to be the total taxable value of land and additions on the property. | Land | Improvement |
|---|---|---|---|---|
| 2025 | $274 | $71,379 | -- | -- |
| 2024 | $274 | $64,890 | -- | -- |
| 2023 | $1,552 | $58,991 | $0 | $0 |
| 2022 | $1,486 | $53,628 | $0 | $0 |
| 2021 | $1,375 | $48,753 | $26,000 | $37,903 |
| 2020 | $1,293 | $44,321 | $22,800 | $27,057 |
| 2019 | $1,192 | $40,292 | $20,000 | $20,292 |
| 2018 | $1,100 | $37,092 | $16,800 | $20,292 |
| 2017 | $1,093 | $34,577 | $16,800 | $20,292 |
| 2016 | $993 | $31,434 | $12,000 | $19,434 |
| 2015 | $332 | $31,434 | $12,000 | $19,434 |
Source: Public Records
Map
Nearby Homes