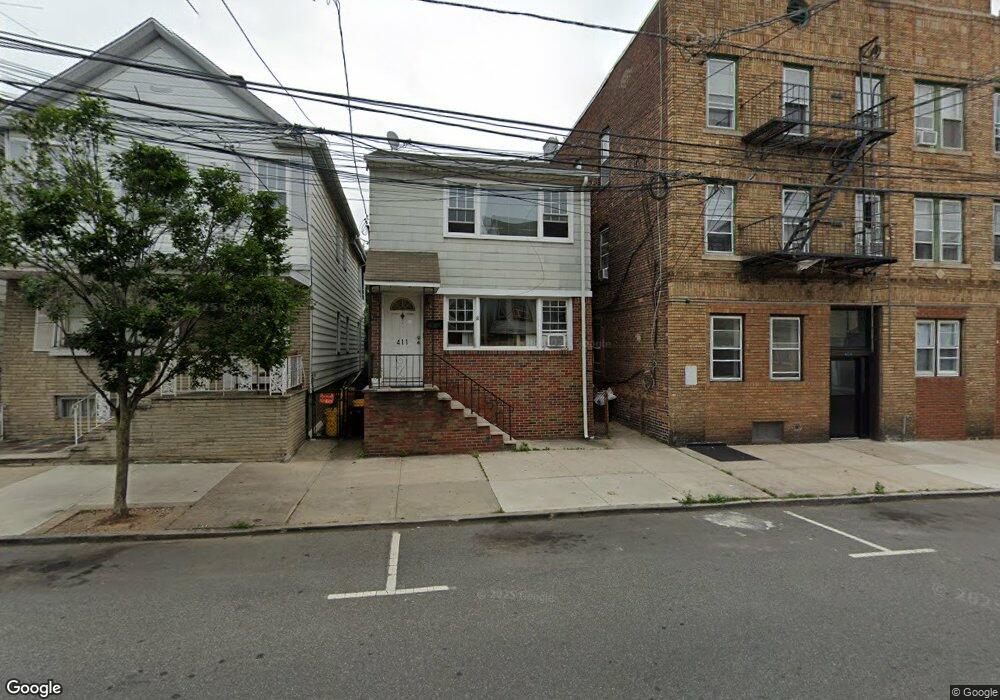
411 N 3rd St East Newark, NJ 07029
Estimated Value: $472,570 - $581,000
4
Beds
2
Baths
1,584
Sq Ft
$331/Sq Ft
Est. Value
About This Home
This home is located at 411 N 3rd St, East Newark, NJ 07029 and is currently estimated at $523,643, approximately $330 per square foot. 411 N 3rd St is a home located in Hudson County with nearby schools including Kennedy Elementary School, Hamilton Intermediate School, and Lincoln No. 3 Elementary School.
Ownership History
Date
Name
Owned For
Owner Type
Purchase Details
Closed on
Sep 9, 2015
Sold by
Cho Jonathan and Lin Miao
Bought by
Wan Chuanhao
Current Estimated Value
Home Financials for this Owner
Home Financials are based on the most recent Mortgage that was taken out on this home.
Original Mortgage
$189,000
Outstanding Balance
$73,228
Interest Rate
3.88%
Mortgage Type
New Conventional
Estimated Equity
$450,415
Purchase Details
Closed on
Jul 31, 2008
Sold by
Salas Yamara
Bought by
Cho Jonathan
Home Financials for this Owner
Home Financials are based on the most recent Mortgage that was taken out on this home.
Original Mortgage
$236,800
Interest Rate
6.4%
Mortgage Type
Purchase Money Mortgage
Purchase Details
Closed on
Oct 10, 2006
Sold by
Alvarez Rosa
Bought by
Salas Yamara
Home Financials for this Owner
Home Financials are based on the most recent Mortgage that was taken out on this home.
Original Mortgage
$80,600
Interest Rate
6.14%
Mortgage Type
Stand Alone Second
Create a Home Valuation Report for This Property
The Home Valuation Report is an in-depth analysis detailing your home's value as well as a comparison with similar homes in the area
Home Values in the Area
Average Home Value in this Area
Purchase History
| Date | Buyer | Sale Price | Title Company |
|---|---|---|---|
| Wan Chuanhao | $270,000 | Chicago Title Ins Company | |
| Cho Jonathan | $296,000 | None Available | |
| Salas Yamara | $403,000 | Clear Advantage Title Inc |
Source: Public Records
Mortgage History
| Date | Status | Borrower | Loan Amount |
|---|---|---|---|
| Open | Wan Chuanhao | $189,000 | |
| Previous Owner | Cho Jonathan | $236,800 | |
| Previous Owner | Salas Yamara | $80,600 | |
| Previous Owner | Salas Yamara | $322,400 |
Source: Public Records
Tax History Compared to Growth
Tax History
| Year | Tax Paid | Tax Assessment Tax Assessment Total Assessment is a certain percentage of the fair market value that is determined by local assessors to be the total taxable value of land and additions on the property. | Land | Improvement |
|---|---|---|---|---|
| 2025 | $7,156 | $241,500 | $55,100 | $186,400 |
| 2024 | $6,789 | $241,500 | $55,100 | $186,400 |
| 2023 | $6,789 | $241,500 | $55,100 | $186,400 |
| 2022 | $6,595 | $241,500 | $55,100 | $186,400 |
| 2021 | $6,562 | $241,500 | $55,100 | $186,400 |
| 2020 | $6,296 | $241,500 | $55,100 | $186,400 |
| 2019 | $6,298 | $241,500 | $55,100 | $186,400 |
| 2018 | $6,175 | $241,500 | $55,100 | $186,400 |
| 2017 | $6,120 | $241,500 | $55,100 | $186,400 |
| 2016 | $7,420 | $80,400 | $14,400 | $66,000 |
| 2015 | $7,287 | $80,400 | $14,400 | $66,000 |
| 2014 | $7,328 | $80,400 | $14,400 | $66,000 |
Source: Public Records
Map
Nearby Homes
- 221 William St
- 323 William St
- 228 Hamilton St
- 313 Central Ave
- 213 Central Ave
- 349 N 2nd St
- 351 N 2nd St
- 344 John St
- 607 Frank E Rodgers Blvd N
- 115 Grant Ave
- 430 Central Ave
- 105 Grant Ave
- 441 John St
- 310 Passaic Ave Unit 308
- 308 Davis Ave
- 133 Sussex St
- 503 Cross St
- 36 6th St
- 200 Dey St Unit 260
- 200 Dey St Unit 266
- 413 N 3rd St
- 405 N 3rd St
- 417 N 3rd St
- 403 N 3rd St
- 108-110 Cross St Unit 2R
- 108-110 Cross St Unit 2M
- 108-110 Cross St Unit 1R
- 108-110 Cross St
- 108 Cross St
- 108 Cross St Unit 2R
- 108 Cross St Unit 2M
- 401 N 3rd St
- 419 N 3rd St
- 0 N 3rd St
- 112 Cross St
- 112 Cross St Unit (1F)
- 112 Cross St Unit (2F)
- 421 N 3rd St
- 311 Central Ave
- 408 N 3rd St Unit 1st Floor