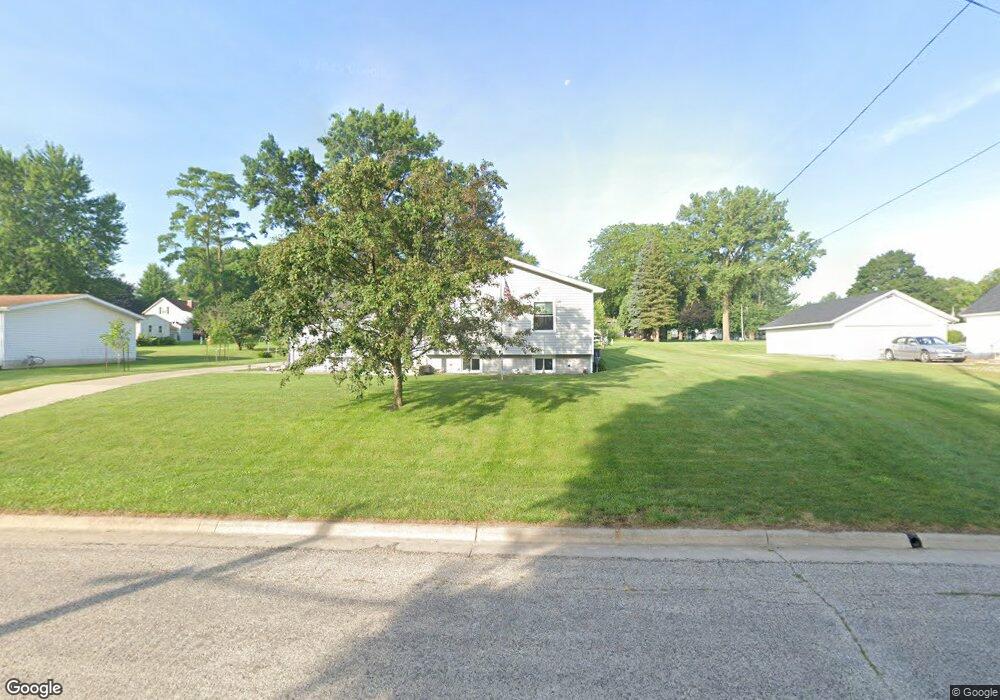
411 N Bluff St Greene, IA 50636
Estimated Value: $163,000 - $221,000
3
Beds
2
Baths
1,842
Sq Ft
$107/Sq Ft
Est. Value
About This Home
This home is located at 411 N Bluff St, Greene, IA 50636 and is currently estimated at $196,723, approximately $106 per square foot. 411 N Bluff St is a home located in Butler County with nearby schools including North Butler Junior/Senior High School.
Ownership History
Date
Name
Owned For
Owner Type
Purchase Details
Closed on
Nov 3, 2014
Sold by
Brinkman John M and Brinkman Lindsay A
Bought by
Lane Paul A and Lane Brenda L
Current Estimated Value
Purchase Details
Closed on
Jul 22, 2005
Sold by
Brinkman Gale L and Brinkman Mary K
Bought by
Brinkman John M and Brinkman Lindsay A
Home Financials for this Owner
Home Financials are based on the most recent Mortgage that was taken out on this home.
Original Mortgage
$77,700
Interest Rate
5.74%
Mortgage Type
USDA
Create a Home Valuation Report for This Property
The Home Valuation Report is an in-depth analysis detailing your home's value as well as a comparison with similar homes in the area
Purchase History
| Date | Buyer | Sale Price | Title Company |
|---|---|---|---|
| Lane Paul A | $127,000 | None Available | |
| Brinkman John M | $55,000 | None Available |
Source: Public Records
Mortgage History
| Date | Status | Borrower | Loan Amount |
|---|---|---|---|
| Previous Owner | Brinkman John M | $77,700 |
Source: Public Records
Tax History
| Year | Tax Paid | Tax Assessment Tax Assessment Total Assessment is a certain percentage of the fair market value that is determined by local assessors to be the total taxable value of land and additions on the property. | Land | Improvement |
|---|---|---|---|---|
| 2025 | $2,498 | $179,670 | $14,540 | $165,130 |
| 2024 | $2,498 | $170,580 | $14,540 | $156,040 |
| 2023 | $2,900 | $170,580 | $14,540 | $156,040 |
| 2022 | $2,768 | $151,220 | $14,540 | $136,680 |
| 2021 | $2,696 | $151,220 | $14,540 | $136,680 |
| 2020 | $2,696 | $136,890 | $14,540 | $122,350 |
| 2019 | $2,476 | $126,370 | $14,540 | $122,350 |
| 2018 | $2,436 | $126,370 | $0 | $0 |
| 2017 | $2,436 | $126,370 | $0 | $0 |
| 2016 | $2,066 | $108,880 | $0 | $0 |
| 2015 | $2,066 | $96,180 | $0 | $0 |
| 2014 | $1,720 | $96,180 | $0 | $0 |
Source: Public Records
Map
Nearby Homes
Your Personal Tour Guide
Ask me questions while you tour the home.