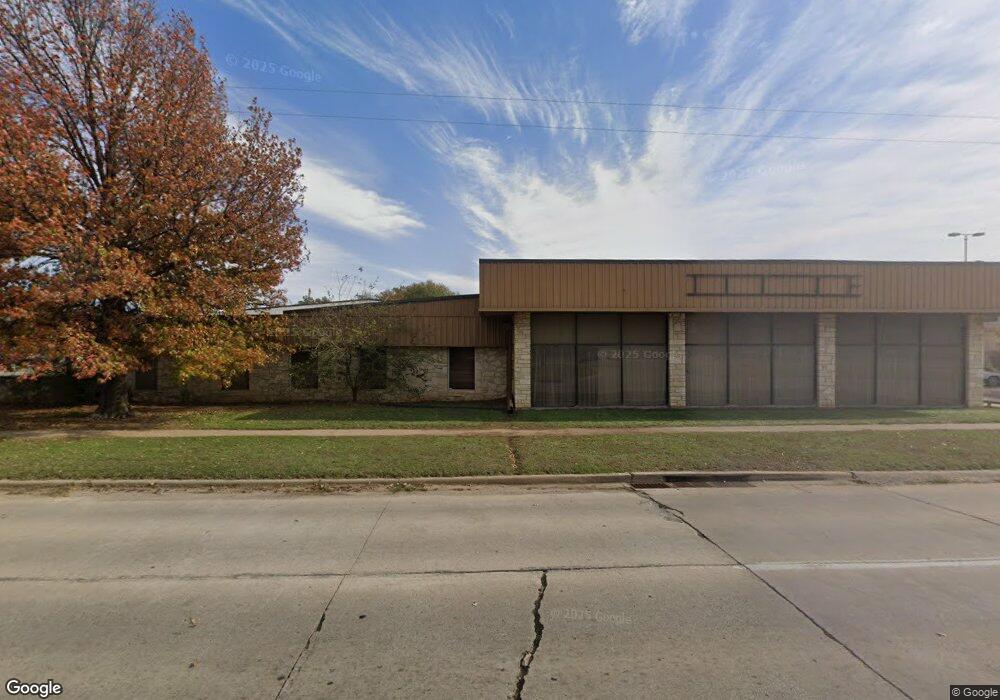
411 N Broadway St Cleveland, OK 74020
Estimated Value: $323,000 - $588,000
2
Beds
2
Baths
4,920
Sq Ft
$90/Sq Ft
Est. Value
About This Home
This home is located at 411 N Broadway St, Cleveland, OK 74020 and is currently estimated at $440,858, approximately $89 per square foot. 411 N Broadway St is a home with nearby schools including Cleveland Primary Elementary School, Cleveland Intermediate Elementary School, and Cleveland Middle School.
Ownership History
Date
Name
Owned For
Owner Type
Purchase Details
Closed on
Jul 2, 2013
Sold by
Sharp John F and Sharp Susan R
Bought by
Reiter Joseph M and Reiter Ynda L
Current Estimated Value
Purchase Details
Closed on
Nov 15, 2002
Sold by
Paw Cty Econ Dev Found
Bought by
Sharp John F and Sharp Susan R
Create a Home Valuation Report for This Property
The Home Valuation Report is an in-depth analysis detailing your home's value as well as a comparison with similar homes in the area
Home Values in the Area
Average Home Value in this Area
Purchase History
| Date | Buyer | Sale Price | Title Company |
|---|---|---|---|
| Reiter Joseph M | $250,000 | -- | |
| Sharp John F | $235,000 | -- |
Source: Public Records
Tax History Compared to Growth
Tax History
| Year | Tax Paid | Tax Assessment Tax Assessment Total Assessment is a certain percentage of the fair market value that is determined by local assessors to be the total taxable value of land and additions on the property. | Land | Improvement |
|---|---|---|---|---|
| 2025 | $3,045 | $32,977 | $9,450 | $23,527 |
| 2024 | $2,880 | $32,016 | $9,450 | $22,566 |
| 2023 | $2,880 | $31,084 | $9,450 | $21,634 |
| 2022 | $2,689 | $29,866 | $9,450 | $20,416 |
| 2021 | $2,708 | $29,866 | $9,450 | $20,416 |
| 2020 | $2,780 | $29,866 | $9,450 | $20,416 |
| 2019 | $2,788 | $30,319 | $9,450 | $20,869 |
| 2018 | $2,880 | $30,577 | $9,450 | $21,127 |
| 2017 | $2,914 | $30,961 | $9,450 | $21,511 |
| 2016 | $2,897 | $30,658 | $9,450 | $21,208 |
| 2015 | $2,706 | $29,765 | $9,450 | $20,315 |
| 2014 | $2,781 | $30,000 | $8,400 | $21,600 |
Source: Public Records
Map
Nearby Homes
- 0 Highway 99
- 500 N Broadway St
- 502 N Broadway St
- 407 N Jordan St
- 506 N Broadway St
- 407 N Division St
- 110 W Miami Ave
- 111 W Kiowa Ave
- 109 W Miami Ave
- 508 N Broadway St
- 301 N Broadway St
- 0 N Broadway St
- 505 N Division St
- 206 E Miami Ave
- 207 E Miami Ave
- 601 N Broadway St
- 408 N Dunlap St
- 307 N Division St
- 504 N Division St
- 511 N Division St