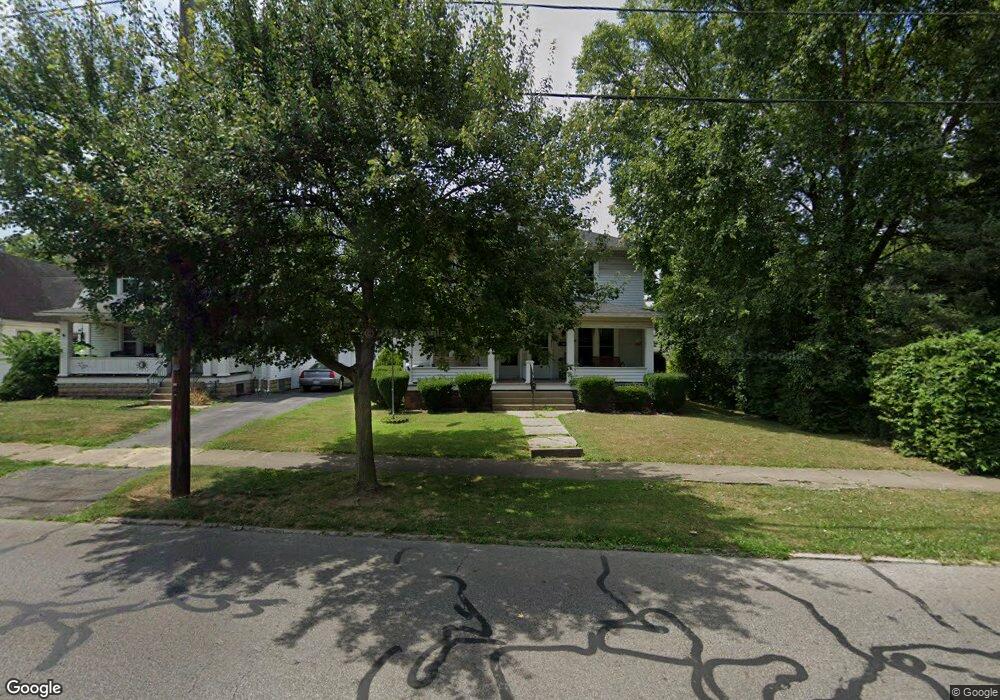
411 N Cherry St Lancaster, OH 43130
Estimated Value: $219,000 - $338,565
6
Beds
2
Baths
2,600
Sq Ft
$99/Sq Ft
Est. Value
About This Home
This home is located at 411 N Cherry St, Lancaster, OH 43130 and is currently estimated at $258,391, approximately $99 per square foot. 411 N Cherry St is a home located in Fairfield County with nearby schools including Thomas Ewing Junior High School, Lancaster High School, and St Mary Elementary School.
Ownership History
Date
Name
Owned For
Owner Type
Purchase Details
Closed on
Mar 18, 2022
Sold by
Christopher L And Kerrie Lee Hammack Tru
Bought by
Clk Investments Llc
Current Estimated Value
Purchase Details
Closed on
Apr 19, 2018
Sold by
Hammack Christopher L and Hammack Kerrie Lee
Bought by
The Christopher L And Kerrie Lee Hammack
Purchase Details
Closed on
Dec 11, 2009
Sold by
Spires Richard A and Martineau Spires Jacquelyn
Bought by
Hammack Christopher L and Hammack Kerrie Lee
Home Financials for this Owner
Home Financials are based on the most recent Mortgage that was taken out on this home.
Original Mortgage
$93,750
Interest Rate
4.9%
Mortgage Type
New Conventional
Purchase Details
Closed on
Dec 10, 2009
Sold by
Johnson Susan and Johnson Van Gregory
Bought by
Hammack Christopher L and Hammack Kerrie Lee
Home Financials for this Owner
Home Financials are based on the most recent Mortgage that was taken out on this home.
Original Mortgage
$93,750
Interest Rate
4.9%
Mortgage Type
New Conventional
Purchase Details
Closed on
Oct 22, 1992
Sold by
Spires Joan E
Bought by
Spires Joan E
Purchase Details
Closed on
Jun 1, 1989
Create a Home Valuation Report for This Property
The Home Valuation Report is an in-depth analysis detailing your home's value as well as a comparison with similar homes in the area
Home Values in the Area
Average Home Value in this Area
Purchase History
| Date | Buyer | Sale Price | Title Company |
|---|---|---|---|
| Clk Investments Llc | -- | Corbin Thomas James | |
| The Christopher L And Kerrie Lee Hammack | -- | None Available | |
| Hammack Christopher L | $31,300 | Lawyers Title-Lancaster | |
| Hammack Christopher L | $31,300 | Lawyers Title-Lancaster | |
| Hammack Christopher L | $62,500 | Lawyers Title-Lancaster | |
| Spires Joan E | -- | -- | |
| -- | $67,000 | -- |
Source: Public Records
Mortgage History
| Date | Status | Borrower | Loan Amount |
|---|---|---|---|
| Previous Owner | Hammack Christopher L | $93,750 | |
| Previous Owner | Hammack Christopher L | $93,750 |
Source: Public Records
Tax History Compared to Growth
Tax History
| Year | Tax Paid | Tax Assessment Tax Assessment Total Assessment is a certain percentage of the fair market value that is determined by local assessors to be the total taxable value of land and additions on the property. | Land | Improvement |
|---|---|---|---|---|
| 2024 | $6,038 | $67,160 | $10,490 | $56,670 |
| 2023 | $2,495 | $67,160 | $10,490 | $56,670 |
| 2022 | $2,510 | $67,160 | $10,490 | $56,670 |
| 2021 | $2,177 | $54,580 | $10,490 | $44,090 |
| 2020 | $2,088 | $54,580 | $10,490 | $44,090 |
| 2019 | $1,987 | $54,580 | $10,490 | $44,090 |
| 2018 | $1,710 | $42,720 | $10,490 | $32,230 |
| 2017 | $1,712 | $44,610 | $10,490 | $34,120 |
| 2016 | $1,668 | $44,610 | $10,490 | $34,120 |
| 2015 | $1,713 | $44,440 | $10,490 | $33,950 |
| 2014 | $1,633 | $44,440 | $10,490 | $33,950 |
| 2013 | $1,633 | $44,440 | $10,490 | $33,950 |
Source: Public Records
Map
Nearby Homes
- 627 Harding Ave
- 844 E Wheeling St
- 632 N Eastwood Ave
- 846 E Main St
- 700 E Allen St
- 641 King St
- 1408 E Wheeling St
- 1106 E Walnut St
- 629 E Wheeling St
- 608 E Mulberry St
- 619 E Main St
- 403 S Ewing St
- 538 E 6th Ave
- 534 E Wheeling St
- 571 E Chestnut St
- 545 E Main St
- 521 E Allen St
- 1323 E Fair Ave
- 1560 E Main St
- 1285 Huffer Ave
- 409 N Cherry St
- 1054 E 5th Ave
- 407 N Cherry St
- 1050 E 5th Ave
- 401 N Cherry St
- 1027 King St
- 1046 E 5th Ave
- 420 N Cherry St
- 420 N Cherry St Unit N
- 410 N Cherry St
- 1044 E 5th Ave
- 1025 King St
- 400 N Cherry St
- 333 N Cherry St
- 1045 E 5th Ave
- 330 N Cherry St
- 1022 E 5th Ave
- 1023 King St
- 324 N Cherry St
- 500 N Cherry St