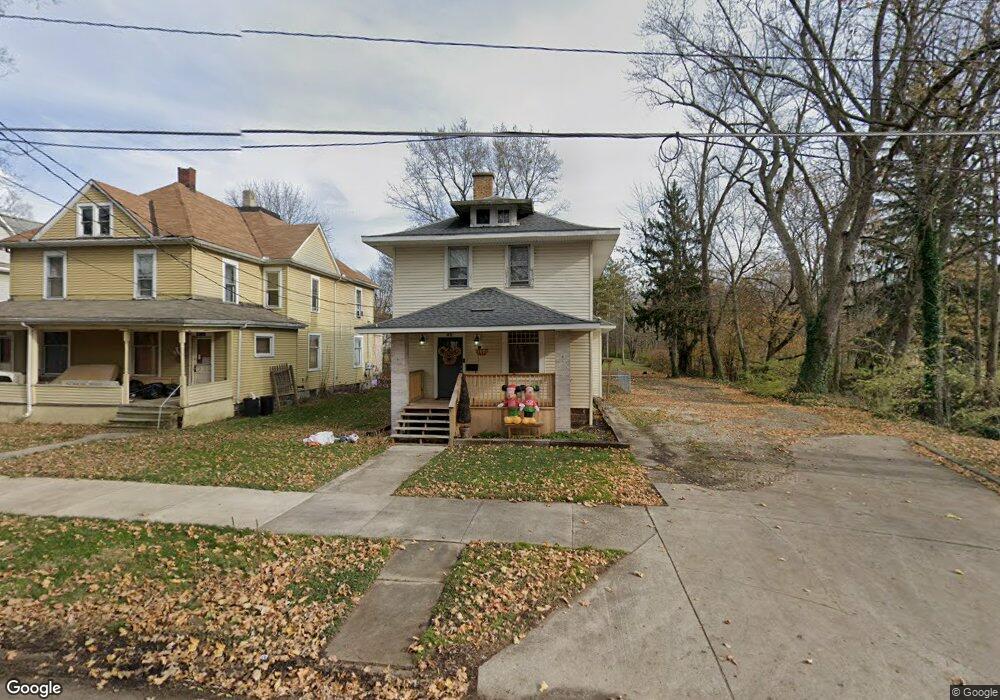
411 N Columbus St Galion, OH 44833
Estimated Value: $113,000 - $154,000
3
Beds
2
Baths
1,274
Sq Ft
$102/Sq Ft
Est. Value
About This Home
This home is located at 411 N Columbus St, Galion, OH 44833 and is currently estimated at $130,128, approximately $102 per square foot. 411 N Columbus St is a home located in Crawford County with nearby schools including Galion Primary School, Galion Intermediate School, and Galion Middle School.
Ownership History
Date
Name
Owned For
Owner Type
Purchase Details
Closed on
Apr 12, 2022
Current Estimated Value
Purchase Details
Closed on
May 18, 2018
Sold by
Keller David Wm and David Wm Keller Living Trust
Bought by
Hedges Darrien M
Home Financials for this Owner
Home Financials are based on the most recent Mortgage that was taken out on this home.
Original Mortgage
$52,050
Interest Rate
4.4%
Mortgage Type
New Conventional
Purchase Details
Closed on
Feb 24, 2012
Sold by
Dameron Olly M
Bought by
Richmond Bobby J
Purchase Details
Closed on
Sep 17, 2010
Sold by
Reynolds Gregory L
Bought by
Dameron Holly M
Home Financials for this Owner
Home Financials are based on the most recent Mortgage that was taken out on this home.
Original Mortgage
$7,281
Interest Rate
4.42%
Mortgage Type
New Conventional
Create a Home Valuation Report for This Property
The Home Valuation Report is an in-depth analysis detailing your home's value as well as a comparison with similar homes in the area
Home Values in the Area
Average Home Value in this Area
Purchase History
| Date | Buyer | Sale Price | Title Company |
|---|---|---|---|
| -- | -- | -- | |
| Hedges Darrien M | $55,000 | Old Crawford Ladn Title | |
| Richmond Bobby J | $5,800 | None Available | |
| Dameron Holly M | -- | -- |
Source: Public Records
Mortgage History
| Date | Status | Borrower | Loan Amount |
|---|---|---|---|
| Previous Owner | Hedges Darrien M | $52,050 | |
| Previous Owner | Dameron Holly M | $7,281 |
Source: Public Records
Tax History Compared to Growth
Tax History
| Year | Tax Paid | Tax Assessment Tax Assessment Total Assessment is a certain percentage of the fair market value that is determined by local assessors to be the total taxable value of land and additions on the property. | Land | Improvement |
|---|---|---|---|---|
| 2024 | $1,216 | $34,380 | $4,750 | $29,630 |
| 2023 | $1,216 | $21,430 | $4,220 | $17,210 |
| 2022 | $967 | $21,430 | $4,220 | $17,210 |
| 2021 | $992 | $21,430 | $4,220 | $17,210 |
| 2020 | $908 | $19,130 | $4,220 | $14,910 |
| 2019 | $935 | $19,130 | $4,220 | $14,910 |
| 2018 | $934 | $19,130 | $4,220 | $14,910 |
| 2017 | $928 | $15,110 | $4,220 | $10,890 |
| 2016 | $742 | $15,110 | $4,220 | $10,890 |
| 2015 | $741 | $15,110 | $4,220 | $10,890 |
| 2014 | $756 | $15,110 | $4,220 | $10,890 |
| 2013 | $756 | $15,110 | $4,220 | $10,890 |
Source: Public Records
Map
Nearby Homes
- 147 Erie St
- 323 E Payne Ave
- 418 Gill Ave
- 134 N Riblet St
- 239 South St
- 000 Buehler St Unit Parcel 1
- 0 Bender Ave Unit Parcel 6 225032073
- 359 S Market St
- 136 Orange St
- 337 Grove Ave
- 341 Grove Ave
- 0 Ohio 598
- 1527 Fairview Rd
- 453 S Pierce St
- 910 Edward St
- 911 Charles St
- 226 1st Ave
- 229 E Parson St
- 771 S East St
- 438 Mackey St
- 417 N Columbus St
- 367 N Columbus St
- 423 N Columbus St
- 219 Sherman St
- 221 Sherman St
- 408 N Columbus St
- 414 N Columbus St
- 418 N Columbus St
- 365 N Columbus St
- 420 N Columbus St
- 366 N Columbus St
- 221 Sherman (P)
- 227 Sherman St
- 422 N Columbus St
- 359 N Columbus St
- 502 Columbus
- 370 N Columbus St
- 234 Olentangy Ct
- 123 Sherman St
- 233 Sherman St