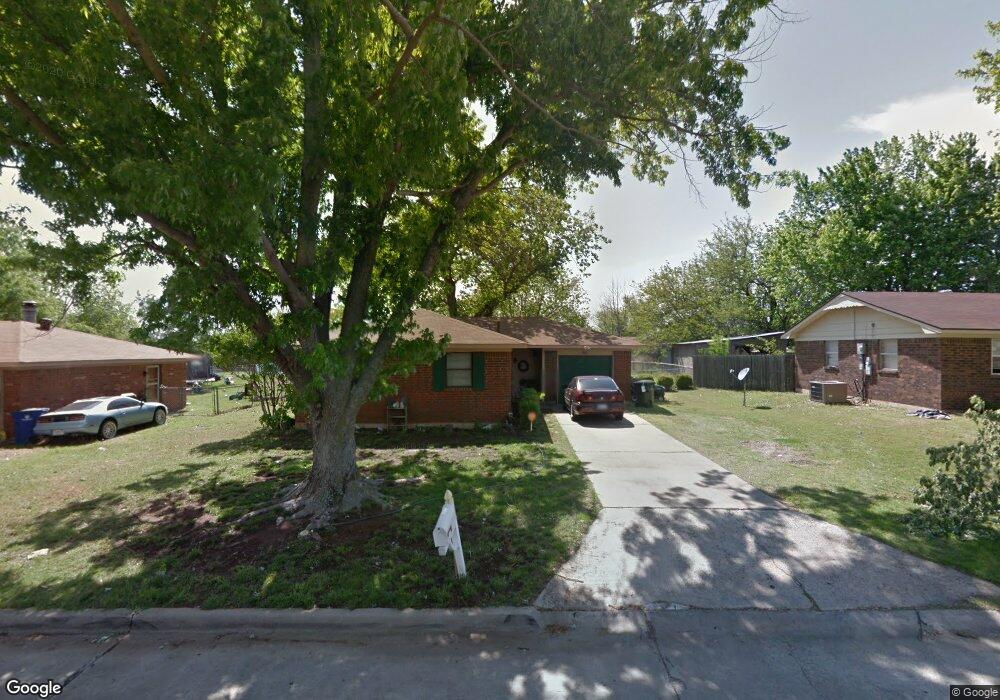
411 N J St Duncan, OK 73533
Estimated Value: $83,437 - $102,000
3
Beds
2
Baths
1,125
Sq Ft
$85/Sq Ft
Est. Value
About This Home
This home is located at 411 N J St, Duncan, OK 73533 and is currently estimated at $96,109, approximately $85 per square foot. 411 N J St is a home located in Stephens County with nearby schools including Woodrow Wilson Elementary School, Duncan Middle School, and Duncan High School.
Ownership History
Date
Name
Owned For
Owner Type
Purchase Details
Closed on
May 8, 2018
Sold by
Blunt Renee and Blunt John
Bought by
Blunt John and Blunt Renee
Current Estimated Value
Home Financials for this Owner
Home Financials are based on the most recent Mortgage that was taken out on this home.
Original Mortgage
$70,000
Outstanding Balance
$60,199
Interest Rate
4.44%
Mortgage Type
New Conventional
Estimated Equity
$35,910
Purchase Details
Closed on
May 16, 2006
Sold by
Dang Chau and Nguyen Laura
Bought by
Blunt Renee
Home Financials for this Owner
Home Financials are based on the most recent Mortgage that was taken out on this home.
Original Mortgage
$54,700
Interest Rate
6.5%
Mortgage Type
New Conventional
Purchase Details
Closed on
May 24, 2005
Sold by
Quaid Jeffrey S and Quaid Stephanie L
Bought by
Dang Chau
Purchase Details
Closed on
Sep 1, 1999
Sold by
Hurlocker David A
Purchase Details
Closed on
Feb 2, 1996
Sold by
Rolen Steven Neel
Create a Home Valuation Report for This Property
The Home Valuation Report is an in-depth analysis detailing your home's value as well as a comparison with similar homes in the area
Home Values in the Area
Average Home Value in this Area
Purchase History
| Date | Buyer | Sale Price | Title Company |
|---|---|---|---|
| Blunt John | -- | Nationa Title Of Okc | |
| Blunt Renee | $55,000 | Ward Title & Closing Company | |
| Dang Chau | $47,500 | None Available | |
| -- | $43,000 | -- | |
| -- | $34,500 | -- |
Source: Public Records
Mortgage History
| Date | Status | Borrower | Loan Amount |
|---|---|---|---|
| Open | Blunt John | $70,000 | |
| Closed | Blunt Renee | $54,700 |
Source: Public Records
Tax History Compared to Growth
Tax History
| Year | Tax Paid | Tax Assessment Tax Assessment Total Assessment is a certain percentage of the fair market value that is determined by local assessors to be the total taxable value of land and additions on the property. | Land | Improvement |
|---|---|---|---|---|
| 2025 | $462 | $6,478 | $512 | $5,966 |
| 2024 | $451 | $6,290 | $512 | $5,778 |
| 2023 | $451 | $6,181 | $512 | $5,669 |
| 2022 | $419 | $6,107 | $512 | $5,595 |
| 2021 | $405 | $5,756 | $512 | $5,244 |
| 2020 | $397 | $5,592 | $512 | $5,080 |
| 2019 | $387 | $5,477 | $512 | $4,965 |
| 2018 | $394 | $5,425 | $512 | $4,913 |
| 2017 | $427 | $5,970 | $512 | $5,458 |
| 2016 | $429 | $6,048 | $459 | $5,589 |
| 2015 | $418 | $5,871 | $449 | $5,422 |
| 2014 | $418 | $5,701 | $440 | $5,261 |
Source: Public Records
Map
Nearby Homes