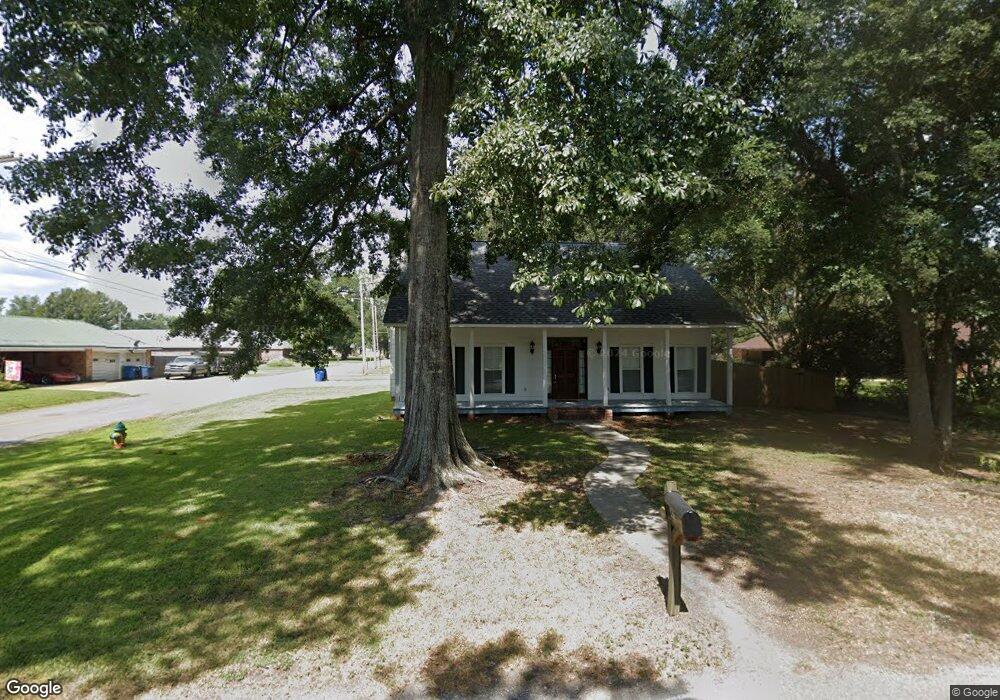
411 N Labauve Rd Brusly, LA 70719
West Baton Rouge Parish NeighborhoodEstimated Value: $275,119 - $294,000
Studio
--
Bath
1,784
Sq Ft
$160/Sq Ft
Est. Value
About This Home
This home is located at 411 N Labauve Rd, Brusly, LA 70719 and is currently estimated at $284,780, approximately $159 per square foot. 411 N Labauve Rd is a home located in West Baton Rouge Parish with nearby schools including Brusly Elementary School, Lukeville Upper Elementary School, and Brusly Middle School.
Ownership History
Date
Name
Owned For
Owner Type
Purchase Details
Closed on
Dec 16, 2021
Sold by
Deveer Jeffrey B and Nelson-Deveer Melissa J
Bought by
Watts Austin G and Madison Janaelaprarie
Current Estimated Value
Home Financials for this Owner
Home Financials are based on the most recent Mortgage that was taken out on this home.
Original Mortgage
$243,000
Outstanding Balance
$224,461
Interest Rate
3.11%
Mortgage Type
Stand Alone Refi Refinance Of Original Loan
Estimated Equity
$60,319
Purchase Details
Closed on
Jun 30, 2005
Sold by
Lejeune Hebert Jr Gerald Joseph and Lejeune Hebert Karla
Bought by
Deveer Jeffrey Brian and Deveer Melissa Jean Nelson
Home Financials for this Owner
Home Financials are based on the most recent Mortgage that was taken out on this home.
Original Mortgage
$140,400
Interest Rate
5.64%
Mortgage Type
New Conventional
Create a Home Valuation Report for This Property
The Home Valuation Report is an in-depth analysis detailing your home's value as well as a comparison with similar homes in the area
Home Values in the Area
Average Home Value in this Area
Purchase History
| Date | Buyer | Sale Price | Title Company |
|---|---|---|---|
| Watts Austin G | $270,000 | None Available | |
| Deveer Jeffrey Brian | $175,500 | None Available |
Source: Public Records
Mortgage History
| Date | Status | Borrower | Loan Amount |
|---|---|---|---|
| Open | Watts Austin G | $243,000 | |
| Previous Owner | Deveer Jeffrey Brian | $140,400 |
Source: Public Records
Tax History
| Year | Tax Paid | Tax Assessment Tax Assessment Total Assessment is a certain percentage of the fair market value that is determined by local assessors to be the total taxable value of land and additions on the property. | Land | Improvement |
|---|---|---|---|---|
| 2024 | $1,044 | $18,280 | $3,230 | $15,050 |
| 2023 | $1,458 | $21,540 | $3,230 | $18,310 |
| 2022 | $2,259 | $21,540 | $3,230 | $18,310 |
| 2021 | $2,310 | $21,540 | $3,230 | $18,310 |
| 2020 | $2,100 | $19,390 | $2,910 | $16,480 |
| 2019 | $2,135 | $18,920 | $3,230 | $15,690 |
| 2018 | $2,173 | $18,920 | $3,230 | $15,690 |
| 2017 | $2,007 | $18,920 | $3,230 | $15,690 |
| 2015 | $1,612 | $18,770 | $3,080 | $15,690 |
| 2014 | $1,586 | $18,770 | $3,080 | $15,690 |
| 2013 | $1,586 | $18,770 | $3,080 | $15,690 |
Source: Public Records
Map
Nearby Homes
- 1685 Pecan St
- 2209 Live Oak Dr
- 445 Venzule Dr
- 2382 Ory Dr
- 6455 Louisiana 1
- 6312 Louisiana 1
- 2809 Live Oak Dr
- 2821 Live Oak Dr
- 4123 Choctaw Rd
- 3561 Lukeville Ln
- 6423 Choctaw Rd
- 526 Gwin St
- 2805 Live Oak Dr
- 2820 Live Oak Dr
- 2824 Live Oak Dr
- 3675 Union Dr
- 6465 Sugar Harvest Ct
- 4632 Mckenzie Ln
- 2218 Silverstone Ave
- 3855 Sandbar Dr
- 1420 Allene St
- 341 N Labauve Rd
- 433 N Labauve Rd
- 2200 N Labauve Ave
- 408 N Labauve Rd
- 424 N Labauve Rd
- 501 N Labauve Ave
- 501 N Labauve Ave
- 323 N Labauve Rd
- 460 N Labauve Rd
- 1423 Allene St
- 1520 Allene St
- 460 N Labauve Ave
- 1521 Allene St
- 1546 Alayna Ln
- 182 N Labauve Ave
- 301 N Labauve Ave
- 350 N Labauve Rd
- 301 N Labauve Rd
- 1526 Allene St