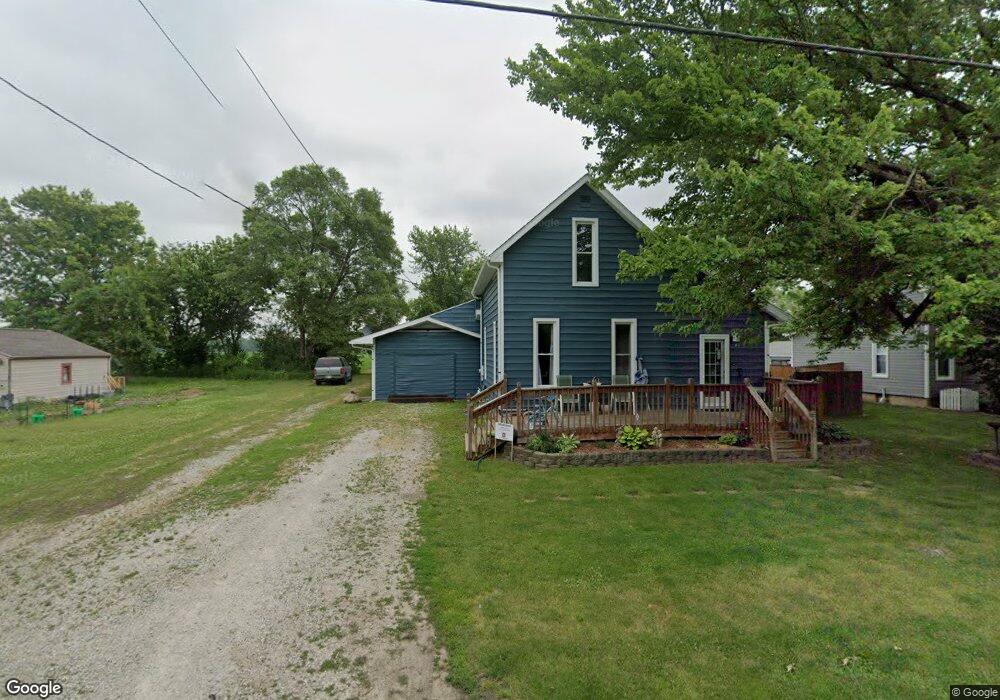
411 N Main St Mulberry, IN 46058
Estimated Value: $166,000 - $265,000
3
Beds
1
Bath
2,372
Sq Ft
$82/Sq Ft
Est. Value
About This Home
This home is located at 411 N Main St, Mulberry, IN 46058 and is currently estimated at $195,460, approximately $82 per square foot. 411 N Main St is a home located in Clinton County with nearby schools including Clinton Prairie Elementary School and Clinton Prairie Junior/Senior High School.
Ownership History
Date
Name
Owned For
Owner Type
Purchase Details
Closed on
Mar 6, 2019
Sold by
Cervantes Antonio
Bought by
Felipe Sofia E and Felipe Gutierrez Jose A
Current Estimated Value
Purchase Details
Closed on
Feb 3, 2014
Sold by
Cervantes Antonio
Bought by
Felipe Sofia E and Felipe Gutierrez Jose A
Home Financials for this Owner
Home Financials are based on the most recent Mortgage that was taken out on this home.
Original Mortgage
$60,000
Interest Rate
4.5%
Mortgage Type
Seller Take Back
Purchase Details
Closed on
Mar 6, 2013
Sold by
Properties
Bought by
Antonio Cervantes
Purchase Details
Closed on
Dec 19, 2012
Sold by
Board Of The County Commissioners
Bought by
Wind Gate Properties Llc
Purchase Details
Closed on
Mar 10, 2003
Sold by
Robert Moore John and Robert Susan L
Bought by
Myers Stephen C and Myers Shannon J
Create a Home Valuation Report for This Property
The Home Valuation Report is an in-depth analysis detailing your home's value as well as a comparison with similar homes in the area
Home Values in the Area
Average Home Value in this Area
Purchase History
| Date | Buyer | Sale Price | Title Company |
|---|---|---|---|
| Felipe Sofia E | -- | None Available | |
| Felipe Sofia E | $70,000 | None Available | |
| Felipe Sofia E | $70,000 | County Assessor | |
| Felipe Sofia E | $70,000 | County Assessor | |
| Antonio Cervantes | $12,500 | Law Offices Of | |
| Cervantes Antonio | -- | None Available | |
| Wind Gate Properties Llc | $1,525 | None Available | |
| Myers Stephen C | $93,750 | -- |
Source: Public Records
Mortgage History
| Date | Status | Borrower | Loan Amount |
|---|---|---|---|
| Previous Owner | Felipe Sofia E | $60,000 |
Source: Public Records
Tax History Compared to Growth
Tax History
| Year | Tax Paid | Tax Assessment Tax Assessment Total Assessment is a certain percentage of the fair market value that is determined by local assessors to be the total taxable value of land and additions on the property. | Land | Improvement |
|---|---|---|---|---|
| 2024 | $711 | $95,300 | $13,200 | $82,100 |
| 2023 | $577 | $88,600 | $13,200 | $75,400 |
| 2022 | $543 | $88,600 | $13,200 | $75,400 |
| 2021 | $782 | $77,000 | $13,200 | $63,800 |
| 2020 | $727 | $97,700 | $13,200 | $84,500 |
| 2019 | $462 | $78,800 | $13,200 | $65,600 |
| 2018 | $451 | $78,800 | $13,200 | $65,600 |
| 2017 | $426 | $78,300 | $13,200 | $65,100 |
| 2016 | $388 | $72,300 | $11,900 | $60,400 |
| 2014 | $283 | $74,400 | $11,900 | $62,500 |
Source: Public Records
Map
Nearby Homes
- 318 N Main St
- 220 E Jackson St
- TBD 38
- County Road 500 W
- 414 E Jackson St
- 0 County Rd 700 W Lot 3 Rd Unit 202519392
- 0 County Rd 700 W Lot 2 Rd Unit 202519391
- 605 E Jackson St
- 318 S Clinton St
- 610 Center St
- 409 S Main St
- 504 Funk St
- 500 S Madison St
- 8553 Valley Farm Rd
- 10870 E State Road 38
- N N Co Road 900 W
- 6767 W Gas Line Rd
- 3505 S 1050 E
- 7255 W Mulberry Jefferson Rd
- 5979 State Route 38