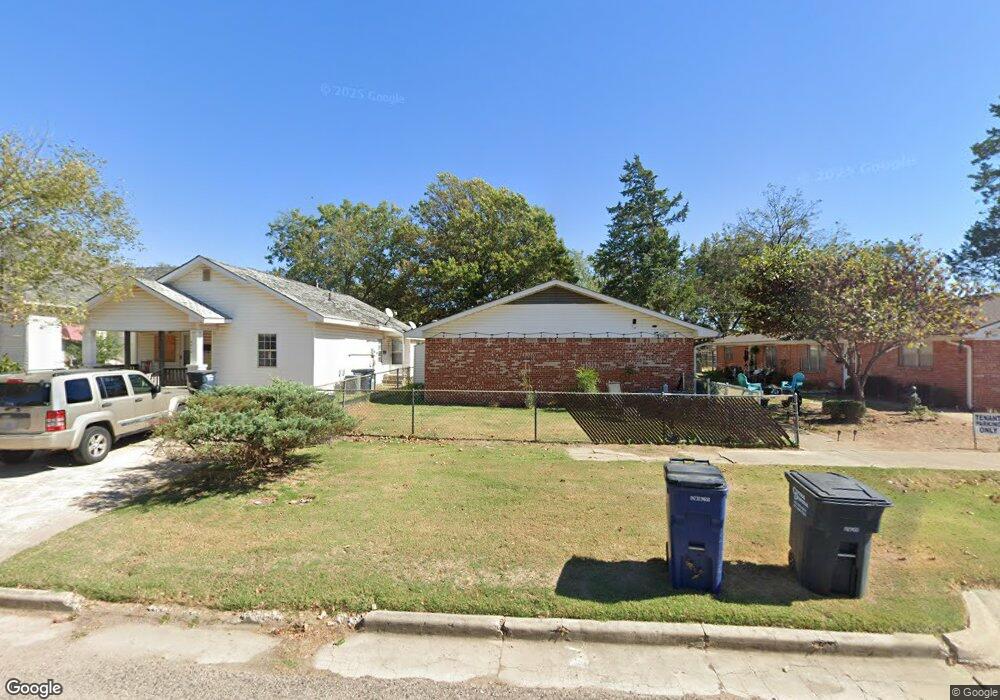
411 N Park Ave Shawnee, OK 74801
Estimated Value: $134,000 - $244,000
4
Beds
2
Baths
2,387
Sq Ft
$76/Sq Ft
Est. Value
About This Home
This home is located at 411 N Park Ave, Shawnee, OK 74801 and is currently estimated at $180,831, approximately $75 per square foot. 411 N Park Ave is a home located in Pottawatomie County with nearby schools including Jefferson Elementary School, Shawnee Middle School, and Shawnee High School.
Ownership History
Date
Name
Owned For
Owner Type
Purchase Details
Closed on
Dec 12, 2024
Sold by
Hdc Family Properties Llc
Bought by
Reuben Peltier Properties Llc
Current Estimated Value
Home Financials for this Owner
Home Financials are based on the most recent Mortgage that was taken out on this home.
Original Mortgage
$544,715
Outstanding Balance
$139,681
Interest Rate
6.84%
Mortgage Type
Construction
Estimated Equity
$41,150
Purchase Details
Closed on
Jan 13, 2022
Sold by
Clark Family 2009 Revocable Trust
Bought by
Hdc Family Properties Llc
Create a Home Valuation Report for This Property
The Home Valuation Report is an in-depth analysis detailing your home's value as well as a comparison with similar homes in the area
Home Values in the Area
Average Home Value in this Area
Purchase History
| Date | Buyer | Sale Price | Title Company |
|---|---|---|---|
| Reuben Peltier Properties Llc | $537,500 | First American Title Insurance | |
| Hdc Family Properties Llc | -- | Stuart & Clover Pllc |
Source: Public Records
Mortgage History
| Date | Status | Borrower | Loan Amount |
|---|---|---|---|
| Open | Reuben Peltier Properties Llc | $544,715 |
Source: Public Records
Tax History Compared to Growth
Tax History
| Year | Tax Paid | Tax Assessment Tax Assessment Total Assessment is a certain percentage of the fair market value that is determined by local assessors to be the total taxable value of land and additions on the property. | Land | Improvement |
|---|---|---|---|---|
| 2024 | $951 | $9,554 | $482 | $9,072 |
| 2023 | $951 | $9,099 | $470 | $8,629 |
| 2022 | $889 | $8,666 | $452 | $8,214 |
| 2021 | $832 | $8,665 | $457 | $8,208 |
| 2020 | $794 | $7,860 | $412 | $7,448 |
| 2019 | $782 | $7,486 | $385 | $7,101 |
| 2018 | $730 | $7,129 | $365 | $6,764 |
| 2017 | $685 | $6,790 | $421 | $6,369 |
| 2016 | $660 | $6,467 | $402 | $6,065 |
| 2015 | $65 | $6,158 | $420 | $5,738 |
| 2014 | $587 | $5,866 | $420 | $5,446 |
Source: Public Records
Map
Nearby Homes
- 426 N Beard Ave
- 615 N Park Ave
- 128 W Ridgewood St
- 318 N Aydelotte Ave
- 548 N Kickapoo Ave
- 618 W Highland St
- 634 N Louisa Ave
- 611 N Chapman Ave
- 820 W Highland St
- 718 N Park Ave
- 717 N Broadway Ave
- 607 W Dewey St
- 735 N Park Ave
- 727 N Beard Ave
- 321 S Aydelotte Ave
- 517 N Ione Ave
- 323 S Park Ave
- 810 N Kickapoo Ave
- 824 N Beard Ave
- 548 N Ione Ave
- 421 N Park Ave
- 409 N Park Ave
- 425 N Park Ave
- 427 N Park Ave
- 416 N Park Ave
- 418 N Park Ave
- 405 N Park Ave
- 418 N Market Ave
- 414 N Park Ave
- 408 N Park Ave
- 410 N Market Ave
- 402 N Park Ave
- 429 N Park Ave
- 310 W 11th St
- 426 N Market Ave
- 402 N Market Ave
- 432 N Market Ave
- 327 N Park Ave
- 325 N Park Ave
- 330 N Market Ave