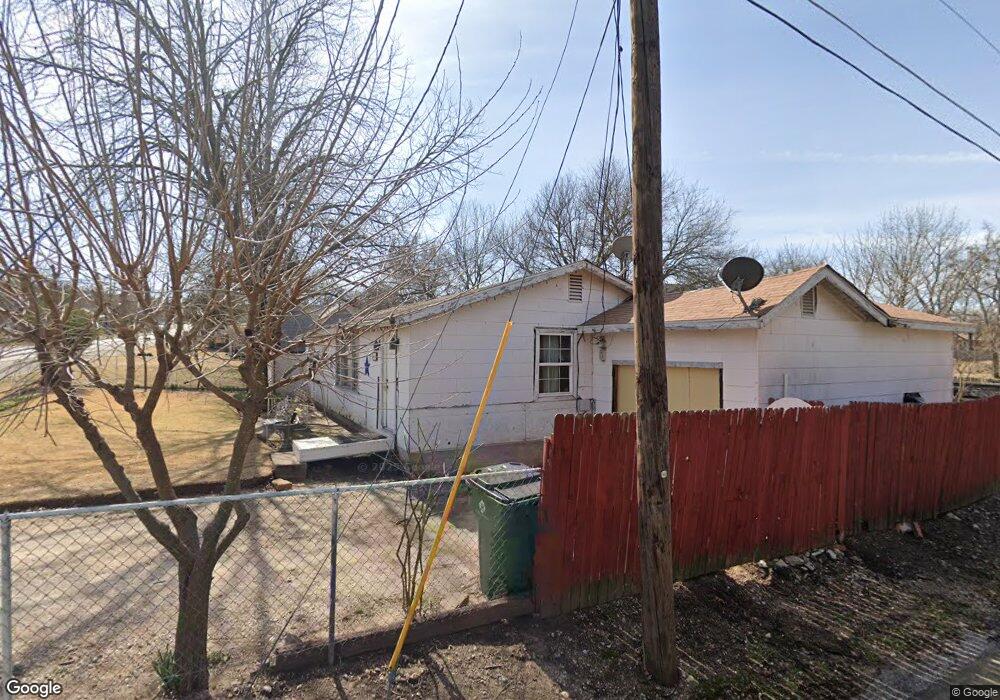
411 N State St Decatur, TX 76234
Estimated Value: $191,861 - $229,000
--
Bed
--
Bath
1,008
Sq Ft
$208/Sq Ft
Est. Value
About This Home
This home is located at 411 N State St, Decatur, TX 76234 and is currently estimated at $209,715, approximately $208 per square foot. 411 N State St is a home located in Wise County with nearby schools including Decatur High School and Victory Christian Academy.
Ownership History
Date
Name
Owned For
Owner Type
Purchase Details
Closed on
Oct 5, 2007
Sold by
Johnson Jon T
Bought by
Marquez Pablo Luevano
Current Estimated Value
Home Financials for this Owner
Home Financials are based on the most recent Mortgage that was taken out on this home.
Original Mortgage
$58,300
Outstanding Balance
$37,042
Interest Rate
6.55%
Mortgage Type
New Conventional
Estimated Equity
$172,673
Purchase Details
Closed on
Aug 24, 2005
Sold by
Johnson Ass W and Johnson Amberly A
Bought by
Johnson John T
Home Financials for this Owner
Home Financials are based on the most recent Mortgage that was taken out on this home.
Original Mortgage
$51,000
Interest Rate
5.78%
Mortgage Type
New Conventional
Purchase Details
Closed on
Jan 21, 1997
Bought by
Marquez Pablo
Purchase Details
Closed on
Jan 1, 1901
Bought by
Marquez Pablo
Create a Home Valuation Report for This Property
The Home Valuation Report is an in-depth analysis detailing your home's value as well as a comparison with similar homes in the area
Home Values in the Area
Average Home Value in this Area
Purchase History
| Date | Buyer | Sale Price | Title Company |
|---|---|---|---|
| Marquez Pablo Luevano | -- | -- | |
| Johnson John T | -- | Standard Land Title Co Llc | |
| Marquez Pablo | -- | -- | |
| Marquez Pablo | -- | -- |
Source: Public Records
Mortgage History
| Date | Status | Borrower | Loan Amount |
|---|---|---|---|
| Open | Marquez Pablo Luevano | $58,300 | |
| Previous Owner | Johnson John T | $51,000 |
Source: Public Records
Tax History Compared to Growth
Tax History
| Year | Tax Paid | Tax Assessment Tax Assessment Total Assessment is a certain percentage of the fair market value that is determined by local assessors to be the total taxable value of land and additions on the property. | Land | Improvement |
|---|---|---|---|---|
| 2025 | $1,486 | $148,970 | -- | -- |
| 2024 | $1,486 | $135,427 | $0 | $0 |
| 2023 | $2,233 | $123,115 | $0 | $0 |
| 2022 | $2,451 | $111,923 | $0 | $0 |
| 2021 | $2,322 | $110,050 | $31,500 | $78,550 |
| 2020 | $2,170 | $98,910 | $29,530 | $69,380 |
| 2019 | $2,084 | $93,580 | $29,530 | $64,050 |
| 2018 | $1,977 | $80,410 | $11,810 | $68,600 |
| 2017 | $1,804 | $69,500 | $11,810 | $57,690 |
| 2016 | $1,684 | $64,880 | $11,810 | $53,070 |
| 2015 | -- | $63,650 | $9,840 | $53,810 |
| 2014 | -- | $62,880 | $9,840 | $53,040 |
Source: Public Records
Map
Nearby Homes
- 1 S Martin Extension
- 407 N Lane St
- 700 N Church St
- 101 E Mulberry St
- 802 N Church St
- 602 N Cates St
- TBD Farm To Market 51
- 305 E Shoemaker St
- 903 N Miller St
- 401 S Holman St
- 304 Cyndilu Ln
- 114 Sondra Lin Blvd
- 307 E Vernon St
- 506 E Main St
- 601 W Brady St
- 606 W Mulberry St
- 709 S Church St
- 204 W Collins St
- 805 Hollyn Dr
- 809 Hollyn Dr