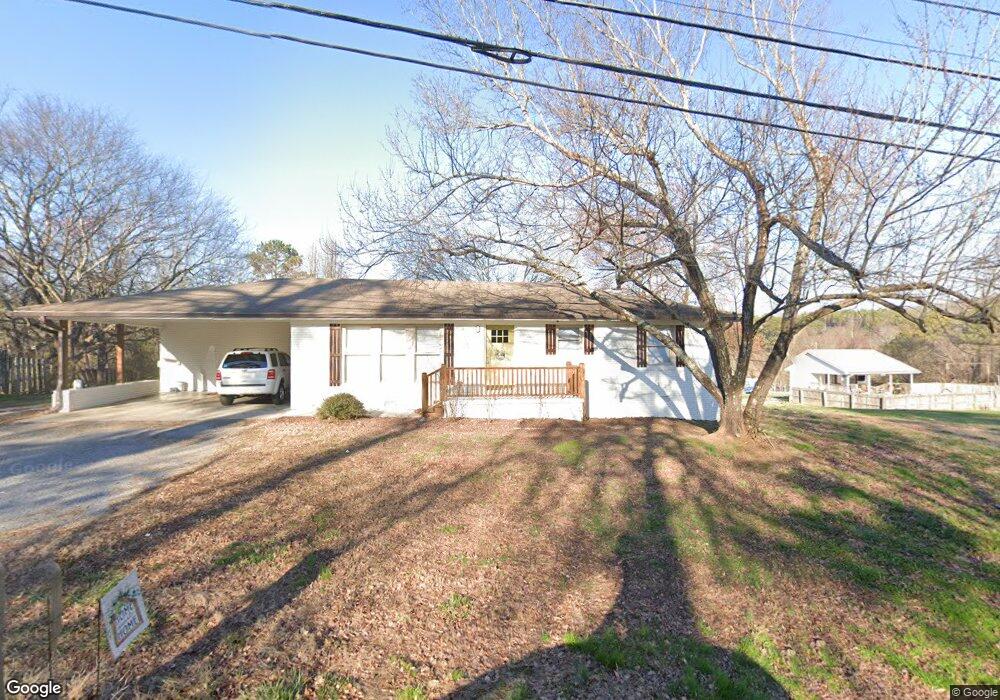
411 N Varnell Rd Tunnel Hill, GA 30755
Estimated Value: $203,000 - $222,556
3
Beds
2
Baths
1,112
Sq Ft
$192/Sq Ft
Est. Value
About This Home
This home is located at 411 N Varnell Rd, Tunnel Hill, GA 30755 and is currently estimated at $213,389, approximately $191 per square foot. 411 N Varnell Rd is a home located in Whitfield County with nearby schools including Tunnel Hill Elementary School, Westside Middle School, and Northwest Whitfield County High School.
Ownership History
Date
Name
Owned For
Owner Type
Purchase Details
Closed on
Mar 11, 2010
Sold by
Federal National Mortgage Association
Bought by
Tunnel Hill Holdings Llc
Current Estimated Value
Home Financials for this Owner
Home Financials are based on the most recent Mortgage that was taken out on this home.
Original Mortgage
$39,671
Interest Rate
4.93%
Mortgage Type
New Conventional
Purchase Details
Closed on
Sep 7, 2007
Sold by
Montoya Alejandro
Bought by
Paniagua Kellie M
Home Financials for this Owner
Home Financials are based on the most recent Mortgage that was taken out on this home.
Original Mortgage
$117,900
Interest Rate
6.55%
Mortgage Type
New Conventional
Purchase Details
Closed on
Apr 26, 2006
Sold by
Paniagua Kellie M
Bought by
Paniagua Kelly M
Purchase Details
Closed on
Nov 2, 2005
Sold by
Not Provided
Bought by
Tunnel Hill Holdings Llc
Purchase Details
Closed on
Mar 1, 1998
Bought by
Cook Jerry Franklin
Create a Home Valuation Report for This Property
The Home Valuation Report is an in-depth analysis detailing your home's value as well as a comparison with similar homes in the area
Home Values in the Area
Average Home Value in this Area
Purchase History
| Date | Buyer | Sale Price | Title Company |
|---|---|---|---|
| Tunnel Hill Holdings Llc | $48,000 | -- | |
| Paniagua Kellie M | $117,900 | -- | |
| Paniagua Kelly M | -- | -- | |
| Tunnel Hill Holdings Llc | $99,900 | -- | |
| Cook Jerry Franklin | -- | -- |
Source: Public Records
Mortgage History
| Date | Status | Borrower | Loan Amount |
|---|---|---|---|
| Closed | Tunnel Hill Holdings Llc | $39,671 | |
| Previous Owner | Paniagua Kellie M | $117,900 |
Source: Public Records
Tax History Compared to Growth
Tax History
| Year | Tax Paid | Tax Assessment Tax Assessment Total Assessment is a certain percentage of the fair market value that is determined by local assessors to be the total taxable value of land and additions on the property. | Land | Improvement |
|---|---|---|---|---|
| 2024 | $952 | $64,326 | $2,732 | $61,594 |
| 2023 | $952 | $31,155 | $2,088 | $29,067 |
| 2022 | $620 | $21,034 | $1,834 | $19,200 |
| 2021 | $621 | $21,034 | $1,834 | $19,200 |
| 2020 | $642 | $21,034 | $1,834 | $19,200 |
| 2019 | $652 | $21,034 | $1,834 | $19,200 |
| 2018 | $654 | $20,758 | $1,558 | $19,200 |
| 2017 | $654 | $20,758 | $1,558 | $19,200 |
| 2016 | $577 | $19,021 | $1,558 | $17,463 |
| 2014 | $581 | $21,580 | $4,117 | $17,463 |
| 2013 | -- | $21,580 | $4,117 | $17,462 |
Source: Public Records
Map
Nearby Homes
- 301 Harper Valley Dr
- 153 Lees Chapel Rd
- 400 Crawford Terrace
- 126 Marilyn Way
- 360 N Lakeshore Dr
- 219 Lineman Way
- 107 N Varnell Rd
- 203 S Cherry St
- 219 Windbrook Dr
- 0 Mount View Dr Unit 1517505
- 0 Mount View Dr Unit RTC2958565
- 315 Mirror Lake Rd
- 2067 Mulberry Ln
- 0 Dockwell Unit 1517509
- 0 Dockwell Unit RTC2958569
- 0 Dockwell Unit 1517510
- 0 Dockwell Unit RTC2958570
- 2056 Mulberry Ln
- 0 Fieldstone Unit RTC2958568
- 0 Fieldstone Unit 1517508
- 407 N Varnell Rd
- 500 Springhill Heights Cir
- 404 N Varnell Rd
- 401 N Varnell Rd
- 407 Harper Valley Dr
- 501 Springhill Heights Cir
- 502 Springhill Heights Cir
- 402 N Varnell Rd
- 527 Springhill Heights Cir
- 0 N Varnell Rd Unit 1296653
- 0 N Varnell Rd Unit 1231950
- 0 N Varnell Rd Unit 1196731
- 0 N Varnell Rd Unit 1267403
- 0 N Varnell Rd Unit 1256093
- 0 N Varnell Rd
- 405 Harper Valley Dr
- 529 Springhill Heights Cir
- 527 Springhill Heights Cir
- 00 Harper Valley Dr
- 403 Harper Valley Dr