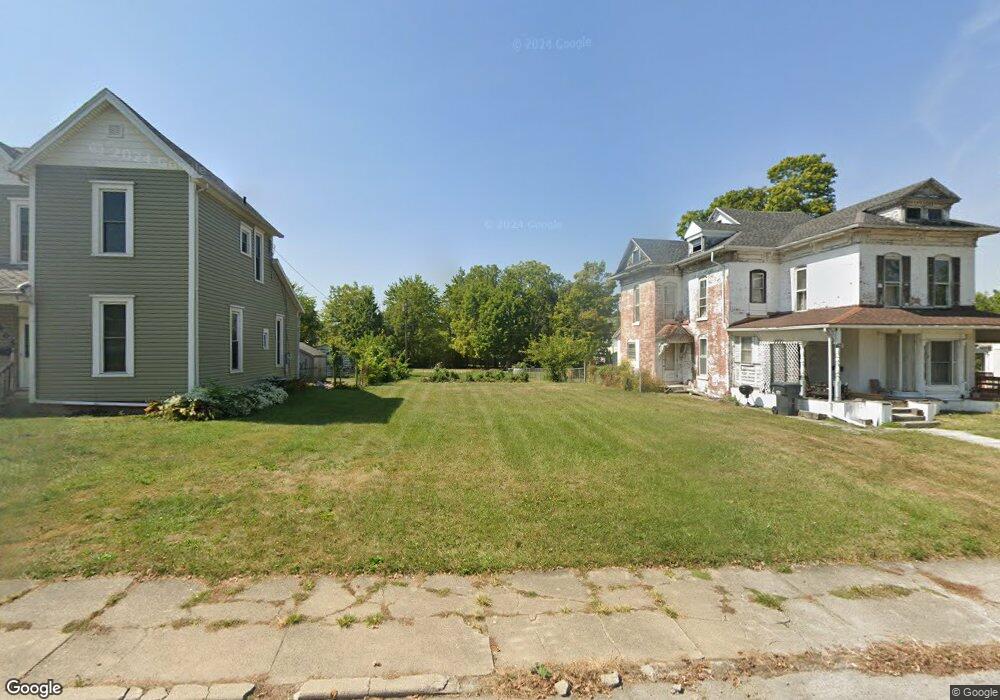
411 N Walnut St Union City, IN 47390
Estimated Value: $108,000
2
Beds
1
Bath
2,026
Sq Ft
$53/Sq Ft
Est. Value
About This Home
This home is located at 411 N Walnut St, Union City, IN 47390 and is currently estimated at $108,000, approximately $53 per square foot. 411 N Walnut St is a home located in Randolph County with nearby schools including North Side Elementary School and Union City Community Jr/Sr High School.
Ownership History
Date
Name
Owned For
Owner Type
Purchase Details
Closed on
Aug 25, 2022
Sold by
Union City Redevelopment Com
Bought by
Clevenger Darrel R and Clevenger Edith Welch
Current Estimated Value
Purchase Details
Closed on
Jun 26, 2018
Sold by
City Of Union
Bought by
Union City Redevelopment Commission
Purchase Details
Closed on
Nov 30, 2017
Sold by
County Of Randolph
Bought by
City Of Union City
Purchase Details
Closed on
Oct 31, 2014
Sold by
Adams Brandon J
Bought by
Jones Brett and Jones Shaun
Purchase Details
Closed on
Oct 7, 2014
Sold by
Bennett Doris M and Carden Wanda
Bought by
Adams Brandon J
Purchase Details
Closed on
Dec 18, 2009
Sold by
Bennett Doris M and Bennett Charles A
Bought by
Bennett Doris M
Purchase Details
Closed on
Aug 14, 2009
Sold by
Bennett Charles A and Bennett Doris M
Bought by
Carden Wanda
Purchase Details
Closed on
Jun 19, 2007
Sold by
Bennett Charles A and Bennett Doris M
Bought by
Bennett Charles A and Bennett Doris M
Create a Home Valuation Report for This Property
The Home Valuation Report is an in-depth analysis detailing your home's value as well as a comparison with similar homes in the area
Home Values in the Area
Average Home Value in this Area
Purchase History
| Date | Buyer | Sale Price | Title Company |
|---|---|---|---|
| Clevenger Darrel R | -- | None Listed On Document | |
| Union City Redevelopment Commission | -- | None Available | |
| City Of Union City | -- | None Available | |
| Jones Brett | -- | None Available | |
| Adams Brandon J | $200 | None Available | |
| Bennett Doris M | -- | None Available | |
| Carden Wanda | -- | None Available | |
| Bennett Charles A | -- | None Available |
Source: Public Records
Tax History Compared to Growth
Tax History
| Year | Tax Paid | Tax Assessment Tax Assessment Total Assessment is a certain percentage of the fair market value that is determined by local assessors to be the total taxable value of land and additions on the property. | Land | Improvement |
|---|---|---|---|---|
| 2024 | $138 | $4,600 | $4,600 | $0 |
| 2023 | $138 | $4,600 | $4,600 | $0 |
| 2022 | $34 | $0 | $0 | $0 |
| 2021 | $28 | $0 | $0 | $0 |
| 2020 | $28 | $0 | $0 | $0 |
| 2019 | $28 | $0 | $0 | $0 |
| 2018 | $600 | $28,200 | $6,300 | $21,900 |
| 2017 | $637 | $29,900 | $6,000 | $23,900 |
| 2016 | $608 | $28,600 | $6,000 | $22,600 |
| 2014 | $709 | $35,400 | $5,700 | $29,700 |
| 2013 | $709 | $33,500 | $5,600 | $27,900 |
Source: Public Records
Map
Nearby Homes
- 508 N High St
- 507 N Howard St
- 612 N Howard St
- 800 W Chestnut St
- 1103 W Oak St
- 504 N Union St
- 504 N Union St Unit Street
- 1210 W Hickory St
- 113 E North St
- 227 South St
- 402 Charles St
- 722 N Union St
- 1013 Caroline Ave
- 299 S Willow Dr Unit 61
- 299 S Willow Dr Unit Lot 63
- 207 Allen Dr
- 305 E North St
- 543 N Walnut St
- 910 Olive Ave Unit 60d
- 918 Moss Ave Unit Lot 81
- 417 N Walnut St
- 405 N Walnut St
- 401 N Walnut St
- 0 4th St SW Unit 46
- 0 4th St SW Unit 1281462
- 0 4th St SW Unit 46 736044
- 610 W Hickory St
- 423 N Walnut St
- 618 W Hickory St
- 427 N Walnut St
- 418 N Walnut St
- 431 N Walnut St
- 626 W Hickory St
- 424 N Walnut St
- 617 W Hickory St Unit 619
- 437 N Walnut St
- 428 N Walnut St
- 434 N Walnut St
- 434 N Walnut St Unit 434NWalnutSt
- 331 N Walnut St