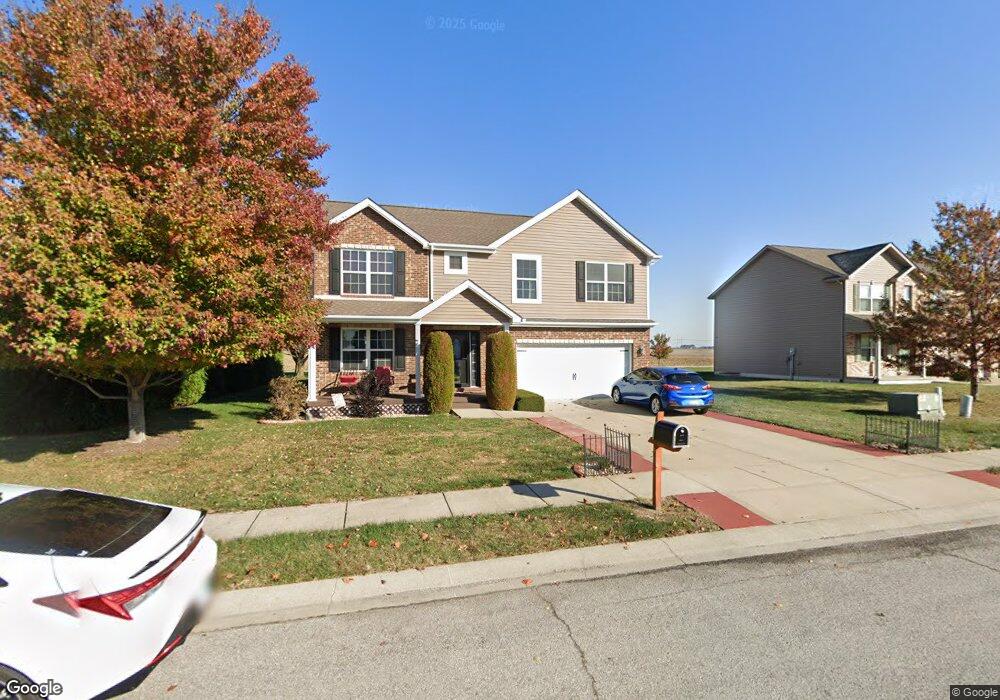
411 Opal Ct Mascoutah, IL 62258
Estimated Value: $385,000 - $437,000
4
Beds
3
Baths
2,500
Sq Ft
$163/Sq Ft
Est. Value
About This Home
This home is located at 411 Opal Ct, Mascoutah, IL 62258 and is currently estimated at $406,535, approximately $162 per square foot. 411 Opal Ct is a home located in St. Clair County with nearby schools including Mascoutah High School and Holy Childhood of Jesus School.
Ownership History
Date
Name
Owned For
Owner Type
Purchase Details
Closed on
Jan 16, 2013
Sold by
Frantz Donald L and Frantz Heather
Bought by
Frantz Donald L and Frantz Heather L
Current Estimated Value
Home Financials for this Owner
Home Financials are based on the most recent Mortgage that was taken out on this home.
Original Mortgage
$218,509
Outstanding Balance
$151,503
Interest Rate
3.31%
Mortgage Type
VA
Estimated Equity
$255,032
Purchase Details
Closed on
Sep 14, 2010
Sold by
Cnr Inc
Bought by
Frantz Donald L and Frantz Heather
Home Financials for this Owner
Home Financials are based on the most recent Mortgage that was taken out on this home.
Original Mortgage
$216,930
Interest Rate
4.54%
Mortgage Type
VA
Purchase Details
Closed on
Feb 2, 2010
Sold by
Stumpf Carolyn L
Bought by
Cnr Inc
Home Financials for this Owner
Home Financials are based on the most recent Mortgage that was taken out on this home.
Original Mortgage
$162,000
Interest Rate
5.75%
Mortgage Type
Construction
Create a Home Valuation Report for This Property
The Home Valuation Report is an in-depth analysis detailing your home's value as well as a comparison with similar homes in the area
Home Values in the Area
Average Home Value in this Area
Purchase History
| Date | Buyer | Sale Price | Title Company |
|---|---|---|---|
| Frantz Donald L | -- | Benchmark Title Company | |
| Frantz Donald L | $210,000 | Community Title Shiloh Llc | |
| Cnr Inc | $36,000 | Community Title |
Source: Public Records
Mortgage History
| Date | Status | Borrower | Loan Amount |
|---|---|---|---|
| Open | Frantz Donald L | $218,509 | |
| Closed | Frantz Donald L | $216,930 | |
| Previous Owner | Cnr Inc | $162,000 |
Source: Public Records
Tax History Compared to Growth
Tax History
| Year | Tax Paid | Tax Assessment Tax Assessment Total Assessment is a certain percentage of the fair market value that is determined by local assessors to be the total taxable value of land and additions on the property. | Land | Improvement |
|---|---|---|---|---|
| 2024 | -- | $111,195 | $16,764 | $94,431 |
| 2023 | -- | $101,622 | $15,321 | $86,301 |
| 2022 | $0 | $92,484 | $13,943 | $78,541 |
| 2021 | $0 | $89,654 | $13,504 | $76,150 |
| 2020 | $6,968 | $84,097 | $12,667 | $71,430 |
| 2019 | $6,968 | $84,097 | $12,667 | $71,430 |
| 2018 | $6,656 | $81,838 | $12,327 | $69,511 |
| 2017 | $6,656 | $78,846 | $11,532 | $67,314 |
| 2016 | $6,343 | $77,711 | $11,366 | $66,345 |
| 2014 | $6,040 | $75,934 | $11,106 | $64,828 |
| 2013 | $1,393 | $74,856 | $10,948 | $63,908 |
Source: Public Records
Map
Nearby Homes
- 414 Turquoise Ct
- 847 Topaz Ct
- 841 Topaz Ct
- 633 Moorland Cir
- 601 Whetstone Ln
- 939 Dere Bere Dr
- 1117 Gulfstream Way
- 1125 Gulfstream Way
- 1153 Gulfstream Way
- 1135 Lear Ln
- 219 N Lebanon St
- 612 N 1st St
- 1204 Lear Ln
- 344 Douglas Ave Unit B
- 25 W Oak St
- 3 W Patterson St
- 9918 Fuesser Rd
- 57 W Patterson St
- 108 E Main St
- 118 W Green St