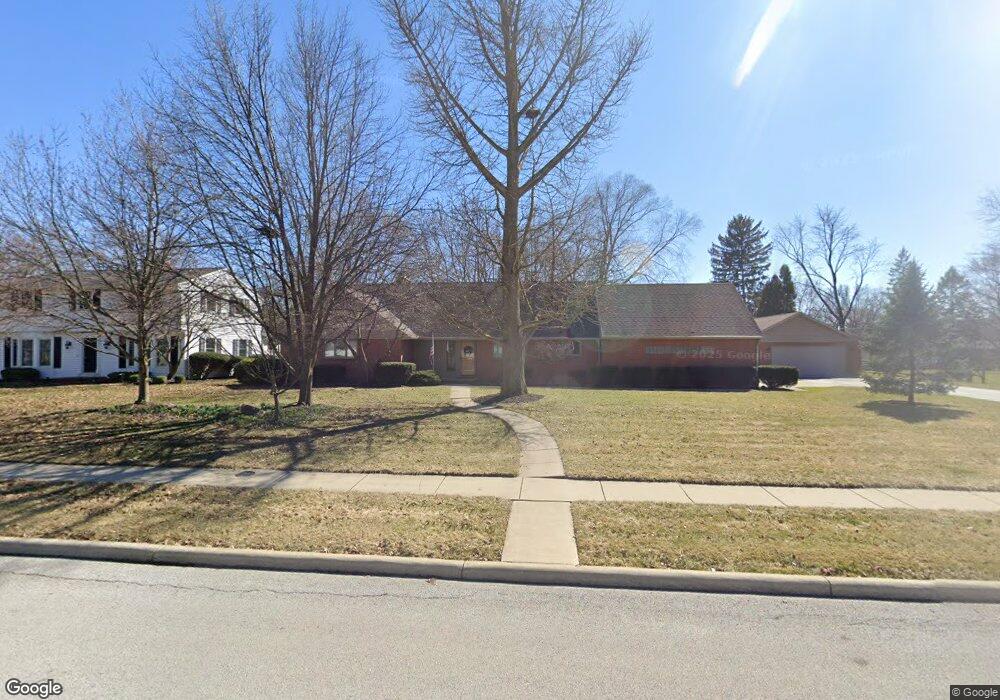
411 Orchard Ln Findlay, OH 45840
Estimated Value: $337,836 - $575,000
4
Beds
3
Baths
2,510
Sq Ft
$162/Sq Ft
Est. Value
About This Home
This home is located at 411 Orchard Ln, Findlay, OH 45840 and is currently estimated at $405,709, approximately $161 per square foot. 411 Orchard Ln is a home located in Hancock County with nearby schools including Chamberlin Hill Elementary School, Jefferson Elementary School, and Donnell Middle School.
Ownership History
Date
Name
Owned For
Owner Type
Purchase Details
Closed on
Jun 18, 2014
Sold by
Humphery Craig W and Humphery Teresa K
Bought by
Gordon David R
Current Estimated Value
Home Financials for this Owner
Home Financials are based on the most recent Mortgage that was taken out on this home.
Original Mortgage
$256,500
Outstanding Balance
$194,953
Interest Rate
4.18%
Mortgage Type
New Conventional
Estimated Equity
$210,756
Purchase Details
Closed on
Aug 12, 2011
Sold by
Thomas John L and Thomas Mildred L
Bought by
Humphrey Craig W and Humphrey Teresa K
Home Financials for this Owner
Home Financials are based on the most recent Mortgage that was taken out on this home.
Original Mortgage
$160,000
Interest Rate
3.73%
Mortgage Type
New Conventional
Purchase Details
Closed on
Oct 21, 2009
Sold by
Thomas John L and Thomas Mildred L
Bought by
Thomas John L and Thomas Mildred L
Purchase Details
Closed on
Sep 18, 2009
Sold by
Workman Jayne Thomas and Thomas James L
Bought by
Thomas John L and Thomas Mildred L
Purchase Details
Closed on
Jun 9, 1989
Bought by
Thomas Mildred J Tr Etal
Create a Home Valuation Report for This Property
The Home Valuation Report is an in-depth analysis detailing your home's value as well as a comparison with similar homes in the area
Home Values in the Area
Average Home Value in this Area
Purchase History
| Date | Buyer | Sale Price | Title Company |
|---|---|---|---|
| Gordon David R | $270,000 | Hancock Title Agency Inc | |
| Humphrey Craig W | $209,900 | Hancock Title | |
| Thomas John L | -- | Attorney | |
| Thomas John L | -- | Attorney | |
| Thomas John L | -- | Attorney | |
| Workman Jayne Thomas | -- | Attorney | |
| Thomas Mildred J Tr Etal | -- | -- |
Source: Public Records
Mortgage History
| Date | Status | Borrower | Loan Amount |
|---|---|---|---|
| Open | Gordon David R | $256,500 | |
| Previous Owner | Humphrey Craig W | $160,000 |
Source: Public Records
Tax History Compared to Growth
Tax History
| Year | Tax Paid | Tax Assessment Tax Assessment Total Assessment is a certain percentage of the fair market value that is determined by local assessors to be the total taxable value of land and additions on the property. | Land | Improvement |
|---|---|---|---|---|
| 2024 | $3,178 | $89,350 | $15,950 | $73,400 |
| 2023 | $3,183 | $89,350 | $15,950 | $73,400 |
| 2022 | $3,172 | $89,350 | $15,950 | $73,400 |
| 2021 | $3,034 | $74,440 | $15,940 | $58,500 |
| 2020 | $3,034 | $74,440 | $15,940 | $58,500 |
| 2019 | $2,973 | $74,440 | $15,940 | $58,500 |
| 2018 | $2,843 | $65,260 | $13,860 | $51,400 |
| 2017 | $2,842 | $65,260 | $13,860 | $51,400 |
| 2016 | $2,797 | $65,260 | $13,860 | $51,400 |
| 2015 | $2,961 | $67,600 | $15,180 | $52,420 |
| 2014 | $2,962 | $67,600 | $15,180 | $52,420 |
| 2012 | $2,886 | $63,700 | $15,180 | $48,520 |
Source: Public Records
Map
Nearby Homes
- 500 Blue Bonnet Dr
- 401 Bittersweet Dr
- 164 Church Hill Dr
- 0 Virbunum Ct Unit 87 305267
- 0 Viburnum Ct Unit 6121366
- 0 Viburnum Ct Unit 20243687
- 200 E Edgar Ave
- 242 E Yates Ave
- 3065 S Main St
- 0 Township Road 77
- 1705 S Main St
- 3323 Western Ave
- 211 Fairlawn Place
- 0 Penrose Dr
- 1621 S Main St
- 1727 Washington Ave
- 1421 Hurd Ave
- 123 Glendale Ave
- 1115 Liberty St
- 804 6th St
- 501 Orchard Ln
- 401 Orchard Ln
- 410 Blue Bonnet Dr
- 412 Orchard Ln
- 500 Orchard Ln
- 509 Orchard Ln
- 406 Orchard Ln
- 506 Orchard Ln
- 311 Orchard Ln
- 400 Orchard Ln
- 515 Orchard Ln
- 310 Blue Bonnet Dr
- 512 Orchard Ln
- 310 Orchard Ln
- 301 Orchard Ln
- 411 Church Hill Dr
- 501 Church Hill Dr
- 518 Orchard Ln
- 405 Church Hill Dr