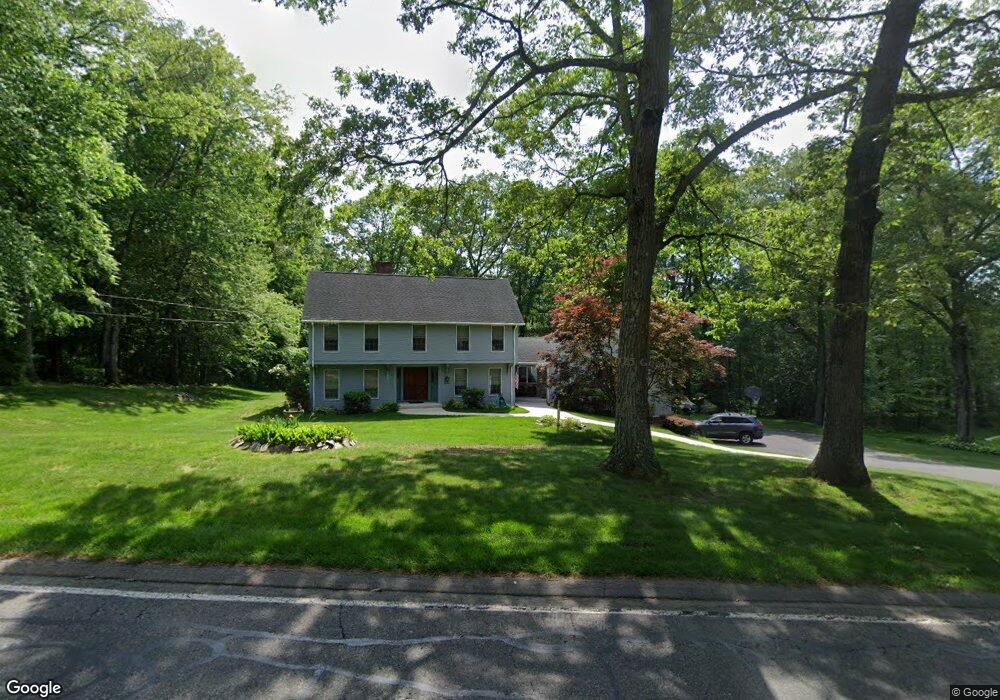
411 Prospect St East Longmeadow, MA 01028
Estimated Value: $576,000 - $764,000
3
Beds
3
Baths
3,097
Sq Ft
$220/Sq Ft
Est. Value
About This Home
This home is located at 411 Prospect St, East Longmeadow, MA 01028 and is currently estimated at $682,830, approximately $220 per square foot. 411 Prospect St is a home located in Hampden County with nearby schools including Meadowbrook Elementary School, Birchland Park Middle School, and East Longmeadow High School.
Ownership History
Date
Name
Owned For
Owner Type
Purchase Details
Closed on
Jul 31, 1995
Sold by
Curley John G and Curley Martha A
Bought by
Quatrano Paul S and Quatrano Anthi P
Current Estimated Value
Home Financials for this Owner
Home Financials are based on the most recent Mortgage that was taken out on this home.
Original Mortgage
$100,000
Interest Rate
7.56%
Mortgage Type
Purchase Money Mortgage
Create a Home Valuation Report for This Property
The Home Valuation Report is an in-depth analysis detailing your home's value as well as a comparison with similar homes in the area
Home Values in the Area
Average Home Value in this Area
Purchase History
| Date | Buyer | Sale Price | Title Company |
|---|---|---|---|
| Quatrano Paul S | $140,000 | -- |
Source: Public Records
Mortgage History
| Date | Status | Borrower | Loan Amount |
|---|---|---|---|
| Open | Quatrano Paul S | $80,000 | |
| Closed | Quatrano Paul S | $70,000 | |
| Closed | Quatrano Paul S | $100,000 |
Source: Public Records
Tax History Compared to Growth
Tax History
| Year | Tax Paid | Tax Assessment Tax Assessment Total Assessment is a certain percentage of the fair market value that is determined by local assessors to be the total taxable value of land and additions on the property. | Land | Improvement |
|---|---|---|---|---|
| 2025 | $10,125 | $547,900 | $134,800 | $413,100 |
| 2024 | $9,685 | $522,400 | $134,800 | $387,600 |
| 2023 | $9,295 | $484,100 | $122,800 | $361,300 |
| 2022 | $8,879 | $437,600 | $110,400 | $327,200 |
| 2021 | $8,771 | $416,500 | $102,400 | $314,100 |
| 2020 | $8,515 | $408,600 | $102,400 | $306,200 |
| 2019 | $8,175 | $397,800 | $99,600 | $298,200 |
| 2018 | $8,127 | $388,100 | $99,600 | $288,500 |
| 2017 | $7,880 | $379,400 | $97,600 | $281,800 |
| 2016 | $7,886 | $373,400 | $94,400 | $279,000 |
| 2015 | $7,737 | $373,400 | $94,400 | $279,000 |
Source: Public Records
Map
Nearby Homes
- 35 Pembroke Terrace
- 0 Rockingham Cir
- 14 High Meadow Cir
- 46 Chestnut St
- 9 Windsor Ln
- 566 Prospect St
- 31 Canterbury Cir
- 75 Lee St
- 20 Halon Terrace Unit Lot 11
- 8 Happy Acres Ln
- 2 Happy Acres Ln
- 0 Chestnut St
- Lot B Jeffery Ln S
- 109 Somers Rd
- 26 High St
- 11 Park Place
- 80 Pease Rd
- Lot 24 Happy Acres Ln
- 1 Jeffrey Ln
- Lot 21 Farmer Cir
- 403 Prospect St
- 12 Pembroke Terrace
- 0 Pembroke Terrace
- 431 Prospect St
- 434 Prospect St
- 440 Prospect St
- 49 Devonshire Terrace
- 391 Prospect St
- 441 Prospect St
- 14 Dartmouth Ln
- 45 Devonshire Terrace
- 449 Prospect St
- 34 Pembroke Terrace
- 361 Prospect St
- 28 Dartmouth Ln
- 450 Prospect St
- 36 Dartmouth Ln
- 11 Devonshire Terrace
- 54 Prospect Hills Dr
- 61 Devonshire Terrace