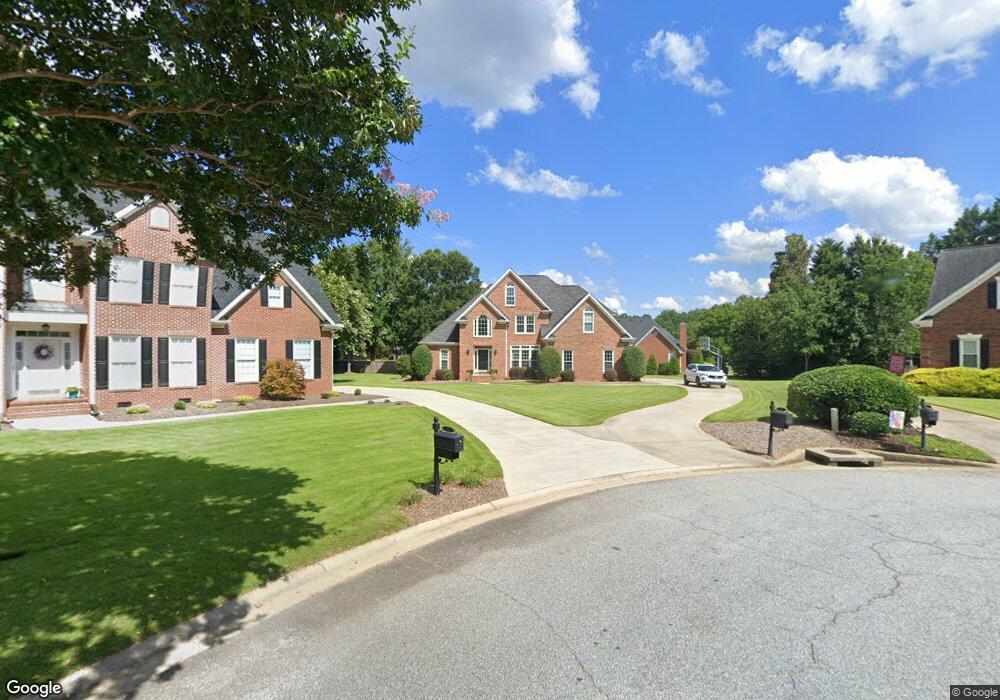
411 Red Fern Trail Simpsonville, SC 29681
Estimated Value: $728,042 - $841,000
4
Beds
3
Baths
3,563
Sq Ft
$220/Sq Ft
Est. Value
About This Home
This home is located at 411 Red Fern Trail, Simpsonville, SC 29681 and is currently estimated at $784,261, approximately $220 per square foot. 411 Red Fern Trail is a home located in Greenville County with nearby schools including Oakview Elementary School, Beck Academy, and J. L. Mann High Academy.
Ownership History
Date
Name
Owned For
Owner Type
Purchase Details
Closed on
Jul 12, 2024
Sold by
Culumovic Patrick J and Culumovic Karen L
Bought by
Culumovic Patrick J and Culumovic Karen L
Current Estimated Value
Purchase Details
Closed on
Apr 13, 2009
Sold by
Dean Robert B
Bought by
Dean Robert B and Dean Brenda K
Home Financials for this Owner
Home Financials are based on the most recent Mortgage that was taken out on this home.
Original Mortgage
$70,000
Interest Rate
5.01%
Mortgage Type
Credit Line Revolving
Purchase Details
Closed on
Jul 1, 2003
Sold by
Petroni Pauline C
Bought by
Culumovic Karen L
Purchase Details
Closed on
Oct 4, 2000
Sold by
Troni John G
Bought by
Troni Pauline C
Purchase Details
Closed on
Oct 12, 1999
Sold by
Herman Paul A
Bought by
Petroni John G
Purchase Details
Closed on
Dec 30, 1998
Sold by
Simons Homes Llc
Bought by
Herman Paul A
Create a Home Valuation Report for This Property
The Home Valuation Report is an in-depth analysis detailing your home's value as well as a comparison with similar homes in the area
Home Values in the Area
Average Home Value in this Area
Purchase History
| Date | Buyer | Sale Price | Title Company |
|---|---|---|---|
| Culumovic Patrick J | -- | None Listed On Document | |
| Culumovic Patrick J | -- | None Listed On Document | |
| Dean Robert B | -- | -- | |
| Culumovic Karen L | $348,500 | -- | |
| Troni Pauline C | -- | -- | |
| Petroni John G | $319,500 | -- | |
| Herman Paul A | $302,000 | -- |
Source: Public Records
Mortgage History
| Date | Status | Borrower | Loan Amount |
|---|---|---|---|
| Previous Owner | Dean Robert B | $70,000 |
Source: Public Records
Tax History Compared to Growth
Tax History
| Year | Tax Paid | Tax Assessment Tax Assessment Total Assessment is a certain percentage of the fair market value that is determined by local assessors to be the total taxable value of land and additions on the property. | Land | Improvement |
|---|---|---|---|---|
| 2024 | $2,597 | $17,590 | $2,760 | $14,830 |
| 2023 | $2,597 | $17,590 | $2,760 | $14,830 |
| 2022 | $2,516 | $17,590 | $2,760 | $14,830 |
| 2021 | $2,501 | $17,590 | $2,760 | $14,830 |
| 2020 | $2,461 | $16,490 | $2,500 | $13,990 |
| 2019 | $2,463 | $16,490 | $2,500 | $13,990 |
| 2018 | $2,611 | $16,490 | $2,500 | $13,990 |
| 2017 | $2,596 | $16,490 | $2,500 | $13,990 |
| 2016 | $2,494 | $412,270 | $62,500 | $349,770 |
| 2015 | $2,486 | $412,270 | $62,500 | $349,770 |
| 2014 | $2,473 | $411,560 | $69,000 | $342,560 |
Source: Public Records
Map
Nearby Homes
- 220 Huddersfield Dr
- 6 Gables Way
- 12 Germander Ct
- 705 Spaulding Farm Rd
- 216 Asheton Lakes Way
- 4 Hanging Moss Ln
- 8 Wild Thorn Ln
- 19 Moray Place
- 7 Hitchcock Ln
- 7 Sweetspire Ln
- 7 Wild Thorn Ln
- 9 Sweetspire Ln
- 127 Riverland Woods Ct
- 503 Spaulding Lake Dr
- 17 Ruby Lake Ln
- 1302 Moore Rd
- 25 Willow Oak Ct
- 110 Oak Creek Ln
- 24 Rolleston Dr
- 1 Big Oak Ct
- 409 Red Fern Trail
- 412 Red Fern Trail
- 104 Huddersfield Dr
- 102 Huddersfield Dr
- 5 Ipswich Ln
- 407 Red Fern Trail
- 200 Huddersfield Dr
- 7 Ipswich Ln
- 100 Huddersfield Dr
- 408 Red Fern Trail
- 204 Huddersfield Dr
- 406 Red Fern Trail
- 405 Red Fern Trail
- 111 Red Branch Ln
- 206 Huddersfield Dr
- 105 Huddersfield Dr
- 404 Red Fern Trail
- 103 Huddersfield Dr
- 8 Ipswich Ln
- 201 Huddersfield Dr