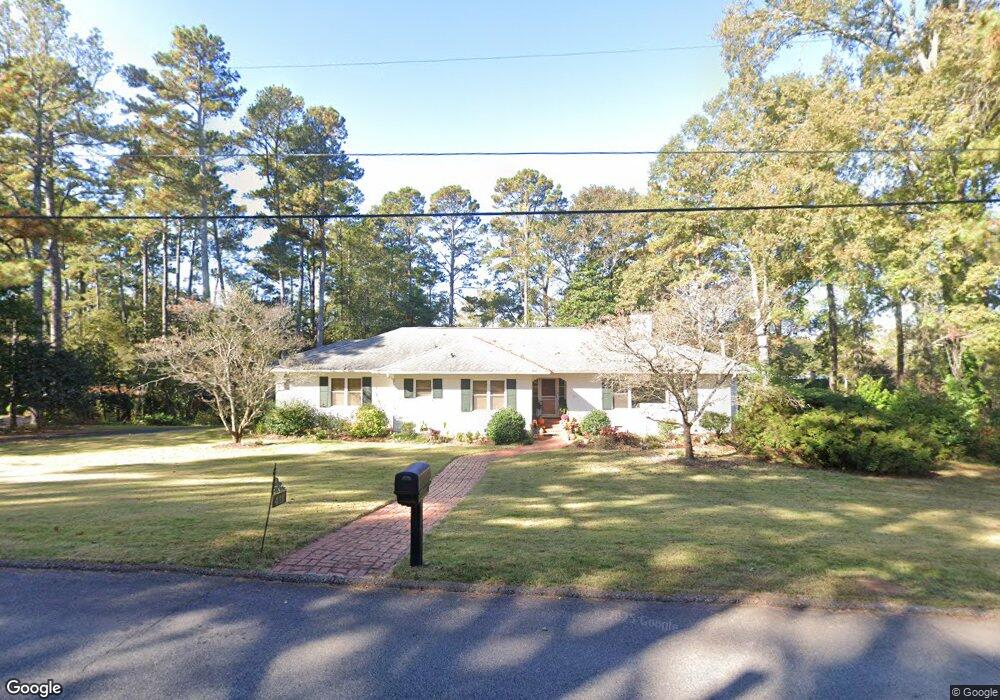
411 Ridgecrest Rd Lagrange, GA 30240
Estimated Value: $371,260 - $450,000
5
Beds
4
Baths
2,658
Sq Ft
$152/Sq Ft
Est. Value
About This Home
This home is located at 411 Ridgecrest Rd, Lagrange, GA 30240 and is currently estimated at $403,565, approximately $151 per square foot. 411 Ridgecrest Rd is a home located in Troup County with nearby schools including Hollis Hand Elementary School, Ethel W. Kight Elementary School, and Franklin Forest Elementary School.
Ownership History
Date
Name
Owned For
Owner Type
Purchase Details
Closed on
May 17, 2021
Sold by
Lancaster Rocio Rangel
Bought by
Sampson Jennifer R
Current Estimated Value
Home Financials for this Owner
Home Financials are based on the most recent Mortgage that was taken out on this home.
Original Mortgage
$266,265
Outstanding Balance
$240,925
Interest Rate
3%
Mortgage Type
New Conventional
Estimated Equity
$162,640
Purchase Details
Closed on
Oct 10, 1977
Sold by
Paul W Austin Jr Etal
Bought by
Lancaster John E and Lancaster Rocio R
Purchase Details
Closed on
May 23, 1975
Sold by
James Carl Deadwyler
Bought by
Paul W Austin Jr Etal
Purchase Details
Closed on
Sep 2, 1971
Sold by
Wyatt L M
Bought by
James Carl Deadwyler
Purchase Details
Closed on
Jan 1, 1955
Sold by
Lane Family Inc
Bought by
Wyatt L M
Create a Home Valuation Report for This Property
The Home Valuation Report is an in-depth analysis detailing your home's value as well as a comparison with similar homes in the area
Home Values in the Area
Average Home Value in this Area
Purchase History
| Date | Buyer | Sale Price | Title Company |
|---|---|---|---|
| Sampson Jennifer R | $274,500 | -- | |
| Lancaster John E | $67,000 | -- | |
| Paul W Austin Jr Etal | $70,000 | -- | |
| James Carl Deadwyler | $45,000 | -- | |
| Wyatt L M | -- | -- |
Source: Public Records
Mortgage History
| Date | Status | Borrower | Loan Amount |
|---|---|---|---|
| Open | Sampson Jennifer R | $266,265 |
Source: Public Records
Tax History Compared to Growth
Tax History
| Year | Tax Paid | Tax Assessment Tax Assessment Total Assessment is a certain percentage of the fair market value that is determined by local assessors to be the total taxable value of land and additions on the property. | Land | Improvement |
|---|---|---|---|---|
| 2024 | $3,238 | $118,716 | $18,000 | $100,716 |
| 2023 | $2,994 | $109,792 | $18,000 | $91,792 |
| 2022 | $2,957 | $105,952 | $18,000 | $87,952 |
| 2021 | $2,661 | $90,232 | $18,000 | $72,232 |
| 2020 | $2,661 | $90,232 | $18,000 | $72,232 |
| 2019 | $2,286 | $77,776 | $13,720 | $64,056 |
| 2018 | $2,193 | $74,716 | $13,720 | $60,996 |
| 2017 | $2,173 | $74,052 | $13,056 | $60,996 |
| 2016 | $2,072 | $70,684 | $13,056 | $57,628 |
| 2015 | $2,095 | $71,336 | $13,708 | $57,628 |
| 2014 | $1,837 | $62,672 | $13,708 | $48,964 |
| 2013 | -- | $68,053 | $13,708 | $54,345 |
Source: Public Records
Map
Nearby Homes
- 609 Cherokee Rd
- 705 Piney Woods Dr
- 603 Country Club Rd
- 203 Waverly Way
- 109 Waverly Way
- 110 Waverly Way
- 105 Saynor Cir
- 408 Gordon St
- 748 Lakewood Dr
- 209 N Lee St
- 0 N Lee St Unit 10550825
- 217 Jefferson St
- 208 Boulevard
- 209 Boulevard
- 145 Turner St
- 206 Broad St
- 109 Thomas St
- 219 Banks St
- 102 Ewing St
- 724 Camellia Dr
- 417 Ridgecrest Rd
- 405 Ridgecrest Rd
- 418 Pineview Terrace
- 424 Pineview Terrace
- 410 Ridgecrest Rd
- 412 Pineview Terrace
- 414 Ridgecrest Rd
- 426 Pineview Terrace
- 420 Ridgecrest Rd
- 421 Ridgecrest Rd
- 403 Ridgecrest Rd
- 408 Ridgecrest Rd
- 415 Pineview Terrace
- 419 Pineview Terrace
- 411 Pineview Terrace
- 100 Loyd Place
- 428 Pineview Terrace
- 404 Ridgecrest Rd
- 701 Cherokee Rd
- 427 Pineview Terrace