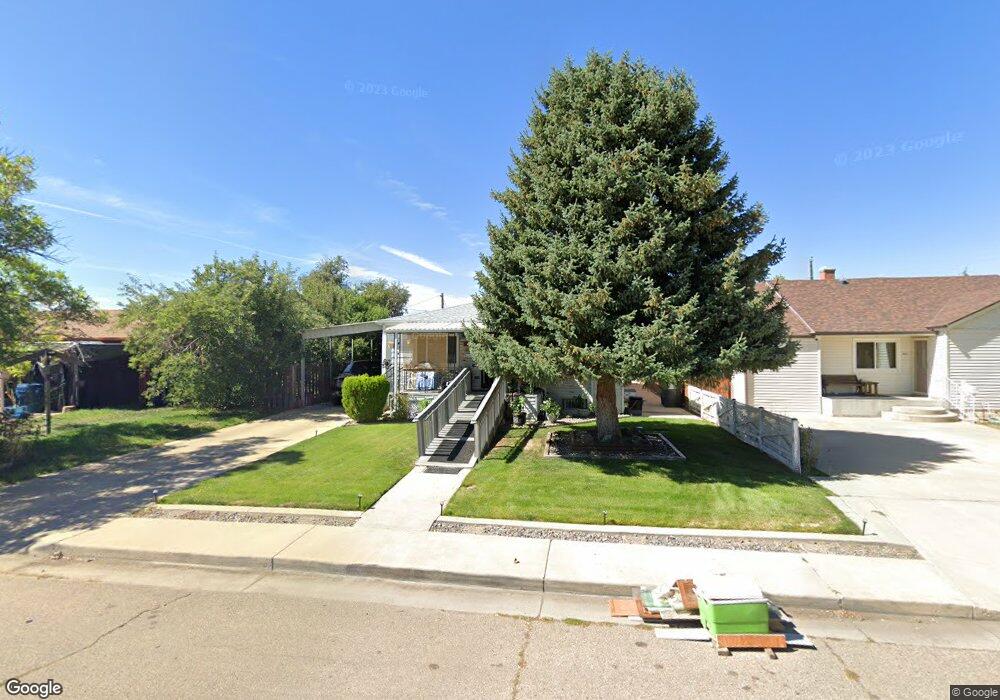
411 S 5th Ave Brighton, CO 80601
Estimated Value: $405,494 - $433,000
3
Beds
1
Bath
1,202
Sq Ft
$344/Sq Ft
Est. Value
About This Home
This home is located at 411 S 5th Ave, Brighton, CO 80601 and is currently estimated at $413,124, approximately $343 per square foot. 411 S 5th Ave is a home located in Adams County with nearby schools including South Elementary School, Vikan Middle School, and Brighton High School.
Ownership History
Date
Name
Owned For
Owner Type
Purchase Details
Closed on
Nov 21, 2024
Sold by
Arguello Floyd and Espinoza Elsie
Bought by
Arguello Floyd and Maughan Jessica
Current Estimated Value
Purchase Details
Closed on
Mar 8, 2024
Sold by
Arguello Floyd and Espinoza Elsie
Bought by
Arguello Floyd and Maugham Jessica
Purchase Details
Closed on
Sep 2, 2015
Sold by
Arguello Bernadita and Arguello Floud
Bought by
Arguello Floyd and Espinoza Elsie
Purchase Details
Closed on
Mar 12, 2008
Sold by
Arguello Bernardita
Bought by
Arguello Bernardita and Arguello Floyd
Create a Home Valuation Report for This Property
The Home Valuation Report is an in-depth analysis detailing your home's value as well as a comparison with similar homes in the area
Home Values in the Area
Average Home Value in this Area
Purchase History
| Date | Buyer | Sale Price | Title Company |
|---|---|---|---|
| Arguello Floyd | -- | None Listed On Document | |
| Arguello Floyd | -- | None Listed On Document | |
| Arguello Floyd | -- | None Listed On Document | |
| Arguello Floyd | -- | None Available | |
| Arguello Bernardita | -- | None Available |
Source: Public Records
Tax History Compared to Growth
Tax History
| Year | Tax Paid | Tax Assessment Tax Assessment Total Assessment is a certain percentage of the fair market value that is determined by local assessors to be the total taxable value of land and additions on the property. | Land | Improvement |
|---|---|---|---|---|
| 2024 | $1,871 | $24,190 | $5,310 | $18,880 |
| 2023 | $1,862 | $27,400 | $5,410 | $21,990 |
| 2022 | $1,898 | $24,230 | $4,930 | $19,300 |
| 2021 | $1,779 | $24,230 | $4,930 | $19,300 |
| 2020 | $1,587 | $23,220 | $4,860 | $18,360 |
| 2019 | $2,295 | $23,220 | $4,860 | $18,360 |
| 2018 | $1,674 | $16,930 | $4,750 | $12,180 |
| 2017 | $1,672 | $16,930 | $4,750 | $12,180 |
| 2016 | $1,080 | $10,900 | $2,390 | $8,510 |
| 2015 | $539 | $5,450 | $1,190 | $4,260 |
| 2014 | -- | $6,010 | $960 | $5,050 |
Source: Public Records
Map
Nearby Homes