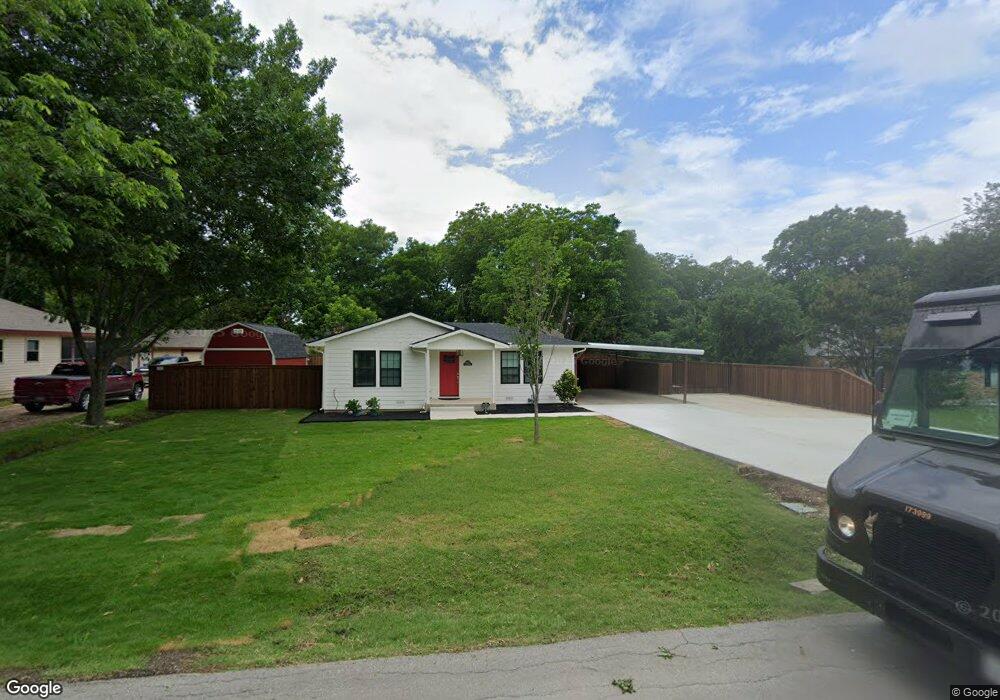
411 S 6th St Midlothian, TX 76065
Estimated Value: $282,652 - $287,000
2
Beds
1
Bath
876
Sq Ft
$325/Sq Ft
Est. Value
About This Home
This home is located at 411 S 6th St, Midlothian, TX 76065 and is currently estimated at $284,826, approximately $325 per square foot. 411 S 6th St is a home located in Ellis County with nearby schools including Irvin Elementary School and Frank Seale Middle School.
Ownership History
Date
Name
Owned For
Owner Type
Purchase Details
Closed on
Mar 22, 2022
Sold by
Travis Satchell Thomas
Bought by
Satchell Elaine Victoria
Current Estimated Value
Home Financials for this Owner
Home Financials are based on the most recent Mortgage that was taken out on this home.
Original Mortgage
$155,300
Outstanding Balance
$145,487
Interest Rate
4.16%
Mortgage Type
New Conventional
Estimated Equity
$139,339
Purchase Details
Closed on
Mar 21, 2022
Sold by
Travis Satchell Thomas
Bought by
Satchell Elaine Victoria
Home Financials for this Owner
Home Financials are based on the most recent Mortgage that was taken out on this home.
Original Mortgage
$155,300
Outstanding Balance
$145,487
Interest Rate
4.16%
Mortgage Type
New Conventional
Estimated Equity
$139,339
Purchase Details
Closed on
Jul 19, 2007
Sold by
Doskocil Phillip E and Doskocil Paula A
Bought by
Parker William E and Parker Carol A
Purchase Details
Closed on
Feb 7, 2005
Sold by
Cunningham Robert
Bought by
Dosckocil Phillip E and Dosckocil Paula A
Create a Home Valuation Report for This Property
The Home Valuation Report is an in-depth analysis detailing your home's value as well as a comparison with similar homes in the area
Home Values in the Area
Average Home Value in this Area
Purchase History
| Date | Buyer | Sale Price | Title Company |
|---|---|---|---|
| Satchell Elaine Victoria | -- | Capital Title | |
| Satchell Elaine Victoria | -- | Capital Title | |
| Parker William E | -- | None Available | |
| Dosckocil Phillip E | -- | None Available |
Source: Public Records
Mortgage History
| Date | Status | Borrower | Loan Amount |
|---|---|---|---|
| Open | Satchell Elaine Victoria | $155,300 | |
| Closed | Satchell Elaine Victoria | $155,300 |
Source: Public Records
Tax History Compared to Growth
Tax History
| Year | Tax Paid | Tax Assessment Tax Assessment Total Assessment is a certain percentage of the fair market value that is determined by local assessors to be the total taxable value of land and additions on the property. | Land | Improvement |
|---|---|---|---|---|
| 2025 | $3,524 | $267,790 | $90,000 | $177,790 |
| 2024 | $3,524 | $260,447 | $90,000 | $170,447 |
| 2023 | $3,524 | $242,614 | $80,000 | $162,614 |
| 2022 | $2,563 | $114,407 | $45,000 | $69,407 |
| 2021 | $1,896 | $80,130 | $33,750 | $46,380 |
| 2020 | $1,952 | $77,610 | $33,750 | $43,860 |
| 2019 | $1,845 | $70,460 | $0 | $0 |
| 2018 | $1,414 | $73,790 | $20,000 | $53,790 |
| 2017 | $1,802 | $69,690 | $20,000 | $49,690 |
| 2016 | $1,639 | $61,560 | $17,000 | $44,560 |
| 2015 | $1,499 | $57,280 | $17,000 | $40,280 |
| 2014 | $1,499 | $56,310 | $0 | $0 |
Source: Public Records
Map
Nearby Homes
- 207 W Alabama Ave
- 3429 Herd Way
- TBD FM 663
- 114 S 6th St
- 809 Deleon Dr
- 1834 Rough Ridge Trail
- 000 N 6th St
- 204 Dylan Way
- 970 Abigail Way
- 208 Dylan Way
- 210 Dylan Way
- 212 Dylan Way
- 978 Abigail Way
- 224 Dylan Way
- 413 Garrett Way
- 417 E Avenue F
- 1019 Magdalena Way
- 1023 Magdalena Way
- 1029 Magdalena Way
- 1015 Abigail Way