Estimated Value: $69,000 - $115,000
2
Beds
1
Bath
1,904
Sq Ft
$53/Sq Ft
Est. Value
About This Home
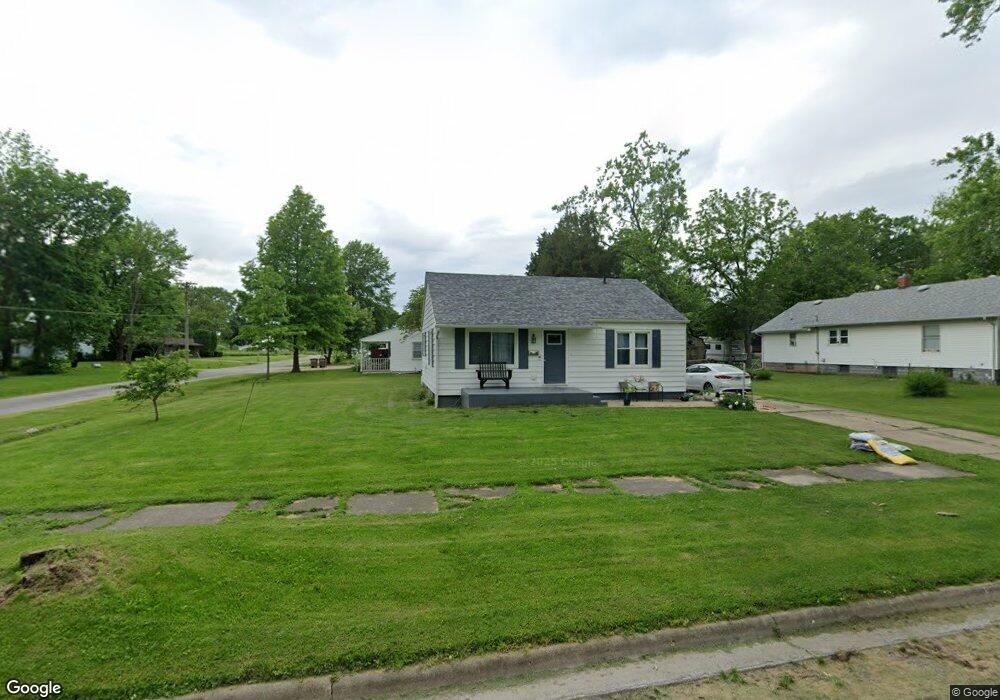
This home is located at 411 S Sherman St, Pana, IL 62557 and is currently estimated at $100,136, approximately $52 per square foot. 411 S Sherman St is a home located in Christian County with nearby schools including Washington Elementary School, Lincoln Elementary School, and Pana Jr High School.
Ownership History
Date
Name
Owned For
Owner Type
Purchase Details
Closed on
Jun 30, 2020
Sold by
Shiels James M and Shiels Yanetta A
Bought by
Michael Diane M
Current Estimated Value
Home Financials for this Owner
Home Financials are based on the most recent Mortgage that was taken out on this home.
Original Mortgage
$72,437
Outstanding Balance
$64,352
Interest Rate
3.2%
Mortgage Type
Purchase Money Mortgage
Estimated Equity
$35,784
Purchase Details
Closed on
Nov 14, 2016
Sold by
Jpmorgan Chase Bank Na
Bought by
Shiels James M
Purchase Details
Closed on
Jul 18, 2016
Sold by
Sheriff Of Christian County
Bought by
Jp Morgan Chase Bank Na
Purchase Details
Closed on
Jan 19, 2012
Sold by
Scott Linda A and Scott Germaine A
Bought by
Wardall Rebekah J
Home Financials for this Owner
Home Financials are based on the most recent Mortgage that was taken out on this home.
Original Mortgage
$51,700
Interest Rate
3.98%
Mortgage Type
New Conventional
Create a Home Valuation Report for This Property
The Home Valuation Report is an in-depth analysis detailing your home's value as well as a comparison with similar homes in the area
Home Values in the Area
Average Home Value in this Area
Purchase History
| Date | Buyer | Sale Price | Title Company |
|---|---|---|---|
| Michael Diane M | $76,250 | None Available | |
| Shiels James M | -- | None Available | |
| Jp Morgan Chase Bank Na | -- | Attorney | |
| Wardall Rebekah J | $48,000 | None Available |
Source: Public Records
Mortgage History
| Date | Status | Borrower | Loan Amount |
|---|---|---|---|
| Open | Michael Diane M | $72,437 | |
| Previous Owner | Wardall Rebekah J | $51,700 | |
| Closed | Jp Morgan Chase Bank Na | $0 |
Source: Public Records
Tax History Compared to Growth
Tax History
| Year | Tax Paid | Tax Assessment Tax Assessment Total Assessment is a certain percentage of the fair market value that is determined by local assessors to be the total taxable value of land and additions on the property. | Land | Improvement |
|---|---|---|---|---|
| 2024 | $679 | $17,993 | $2,389 | $15,604 |
| 2023 | $592 | $17,000 | $2,257 | $14,743 |
| 2022 | $377 | $14,676 | $2,240 | $12,436 |
| 2021 | $347 | $14,388 | $2,196 | $12,192 |
| 2020 | $1,434 | $13,778 | $2,103 | $11,675 |
| 2019 | $1,025 | $10,013 | $2,153 | $7,860 |
| 2018 | $1,020 | $10,000 | $2,105 | $7,895 |
| 2017 | $1,494 | $14,852 | $2,148 | $12,704 |
| 2016 | $1,478 | $14,811 | $2,142 | $12,669 |
| 2015 | $871 | $14,640 | $2,118 | $12,522 |
| 2014 | $896 | $13,617 | $1,970 | $11,647 |
| 2013 | $898 | $14,852 | $1,970 | $12,882 |
| 2011 | $162 | $15,204 | $2,017 | $13,187 |
Source: Public Records
Map
Nearby Homes