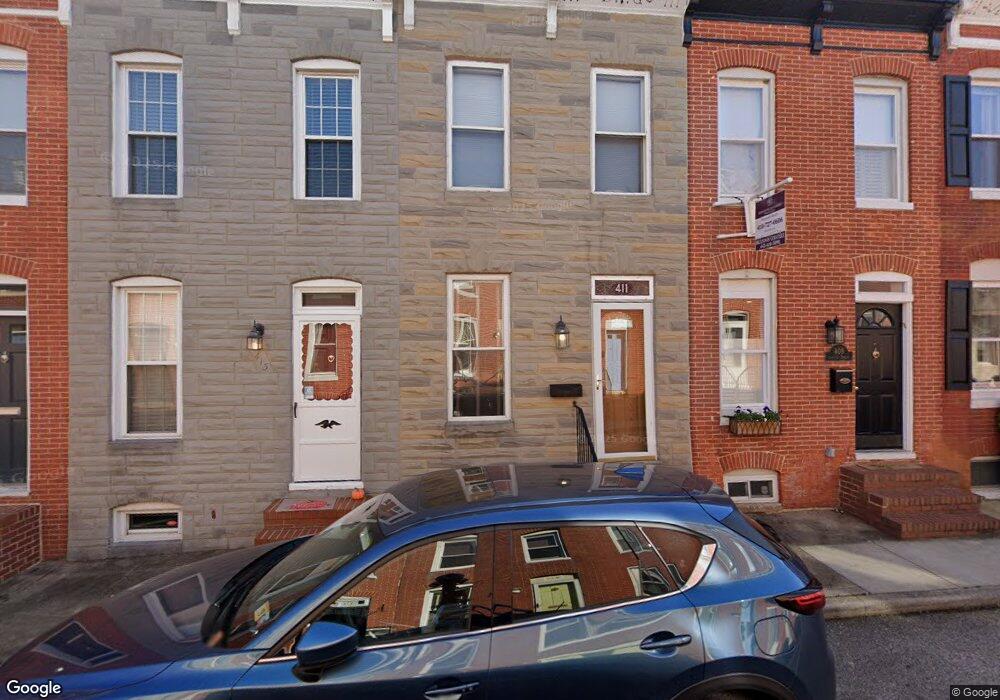
411 Sanders St Baltimore, MD 21230
Riverside NeighborhoodEstimated Value: $297,680 - $332,000
2
Beds
2
Baths
1,000
Sq Ft
$315/Sq Ft
Est. Value
About This Home
This home is located at 411 Sanders St, Baltimore, MD 21230 and is currently estimated at $314,840, approximately $314 per square foot. 411 Sanders St is a home located in Baltimore City with nearby schools including Federal Hill Preparatory School, Booker T. Washington Middle School, and Digital Harbor High School.
Ownership History
Date
Name
Owned For
Owner Type
Purchase Details
Closed on
Feb 25, 2022
Sold by
Delkhoon Sara
Bought by
Delkhoon Sara and Delkhoon Babak
Current Estimated Value
Home Financials for this Owner
Home Financials are based on the most recent Mortgage that was taken out on this home.
Original Mortgage
$146,600
Interest Rate
6.02%
Mortgage Type
New Conventional
Purchase Details
Closed on
Oct 27, 2007
Sold by
Dinan M Joseph
Bought by
Dewese Sara B
Create a Home Valuation Report for This Property
The Home Valuation Report is an in-depth analysis detailing your home's value as well as a comparison with similar homes in the area
Home Values in the Area
Average Home Value in this Area
Purchase History
| Date | Buyer | Sale Price | Title Company |
|---|---|---|---|
| Delkhoon Sara | -- | -- | |
| Dewese Sara B | $260,000 | -- |
Source: Public Records
Mortgage History
| Date | Status | Borrower | Loan Amount |
|---|---|---|---|
| Previous Owner | Delkhoon Sara | $146,600 |
Source: Public Records
Tax History
| Year | Tax Paid | Tax Assessment Tax Assessment Total Assessment is a certain percentage of the fair market value that is determined by local assessors to be the total taxable value of land and additions on the property. | Land | Improvement |
|---|---|---|---|---|
| 2025 | $5,441 | $238,833 | -- | -- |
| 2024 | $5,441 | $231,667 | -- | -- |
| 2023 | $5,273 | $224,500 | $80,000 | $144,500 |
| 2022 | $5,283 | $223,867 | $0 | $0 |
| 2021 | $5,268 | $223,233 | $0 | $0 |
| 2020 | $5,253 | $222,600 | $80,000 | $142,600 |
| 2019 | $5,228 | $222,600 | $80,000 | $142,600 |
| 2018 | $5,253 | $222,600 | $80,000 | $142,600 |
| 2017 | $5,470 | $231,800 | $0 | $0 |
| 2016 | $5,498 | $225,100 | $0 | $0 |
| 2015 | $5,498 | $218,400 | $0 | $0 |
| 2014 | $5,498 | $211,700 | $0 | $0 |
Source: Public Records
Map
Nearby Homes
- 1271 Battery Ave
- 1134 Battery Ave
- 435 E Gittings St
- 443 E Gittings St
- 432 E Clement St
- 418 E Cross St
- 1311 Belt St
- 1254 Harbor Island Walk
- 1225 Harbor Island Walk
- 1220 Harbor Island Walk
- 405 E Clement St
- 413 Grindall St
- 437 Grindall St
- 213 Grindall St
- 132 E Gittings St
- 444 Grindall St
- 23 Pierside Dr Unit 118
- 23 Pierside Dr Unit 326
- 23 Pierside Dr Unit 324
- 23 Pierside Dr Unit 413
Your Personal Tour Guide
Ask me questions while you tour the home.