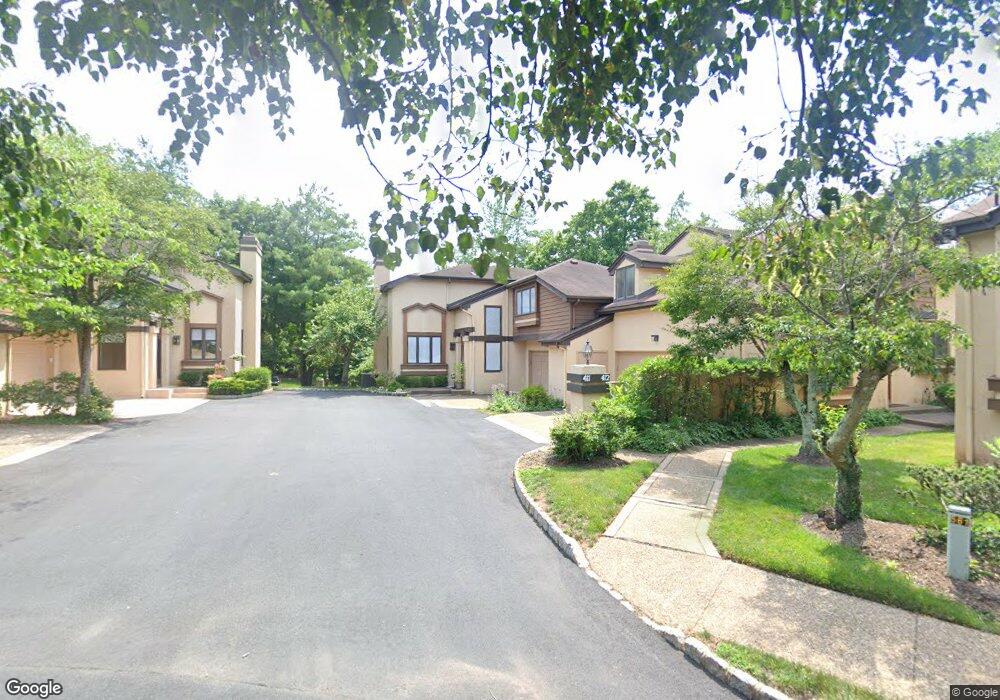
411 Sayre Dr Princeton, NJ 08540
Estimated Value: $811,000 - $851,000
--
Bed
--
Bath
2,217
Sq Ft
$378/Sq Ft
Est. Value
About This Home
This home is located at 411 Sayre Dr, Princeton, NJ 08540 and is currently estimated at $837,026, approximately $377 per square foot. 411 Sayre Dr is a home located in Middlesex County with nearby schools including Town Center Elementary School, Millstone River School, and Thomas R. Grover Middle School.
Ownership History
Date
Name
Owned For
Owner Type
Purchase Details
Closed on
Mar 8, 2005
Sold by
Fraze Patricia Rice
Bought by
Tang Jianxin and Yang Qian
Current Estimated Value
Home Financials for this Owner
Home Financials are based on the most recent Mortgage that was taken out on this home.
Original Mortgage
$359,650
Outstanding Balance
$182,333
Interest Rate
5.61%
Estimated Equity
$654,693
Purchase Details
Closed on
Dec 22, 1993
Sold by
Estate Of Daniel Logan
Bought by
Fraze Scott and Fraze Patricia
Home Financials for this Owner
Home Financials are based on the most recent Mortgage that was taken out on this home.
Original Mortgage
$180,000
Interest Rate
7%
Create a Home Valuation Report for This Property
The Home Valuation Report is an in-depth analysis detailing your home's value as well as a comparison with similar homes in the area
Home Values in the Area
Average Home Value in this Area
Purchase History
| Date | Buyer | Sale Price | Title Company |
|---|---|---|---|
| Tang Jianxin | $480,000 | -- | |
| Fraze Scott | $255,000 | -- |
Source: Public Records
Mortgage History
| Date | Status | Borrower | Loan Amount |
|---|---|---|---|
| Open | Tang Jianxin | $359,650 | |
| Previous Owner | Fraze Scott | $180,000 |
Source: Public Records
Tax History Compared to Growth
Tax History
| Year | Tax Paid | Tax Assessment Tax Assessment Total Assessment is a certain percentage of the fair market value that is determined by local assessors to be the total taxable value of land and additions on the property. | Land | Improvement |
|---|---|---|---|---|
| 2025 | $13,251 | $507,100 | $135,000 | $372,100 |
| 2024 | $12,931 | $507,100 | $135,000 | $372,100 |
| 2023 | $12,931 | $507,100 | $135,000 | $372,100 |
| 2022 | $12,733 | $507,100 | $135,000 | $372,100 |
| 2021 | $11,571 | $498,800 | $135,000 | $363,800 |
| 2020 | $11,833 | $494,700 | $135,000 | $359,700 |
| 2019 | $11,571 | $494,700 | $135,000 | $359,700 |
| 2018 | $11,314 | $494,700 | $135,000 | $359,700 |
| 2017 | $10,992 | $494,700 | $135,000 | $359,700 |
| 2016 | $10,507 | $494,700 | $135,000 | $359,700 |
| 2015 | $11,807 | $467,800 | $190,000 | $277,800 |
| 2014 | $11,690 | $467,800 | $190,000 | $277,800 |
Source: Public Records
Map
Nearby Homes