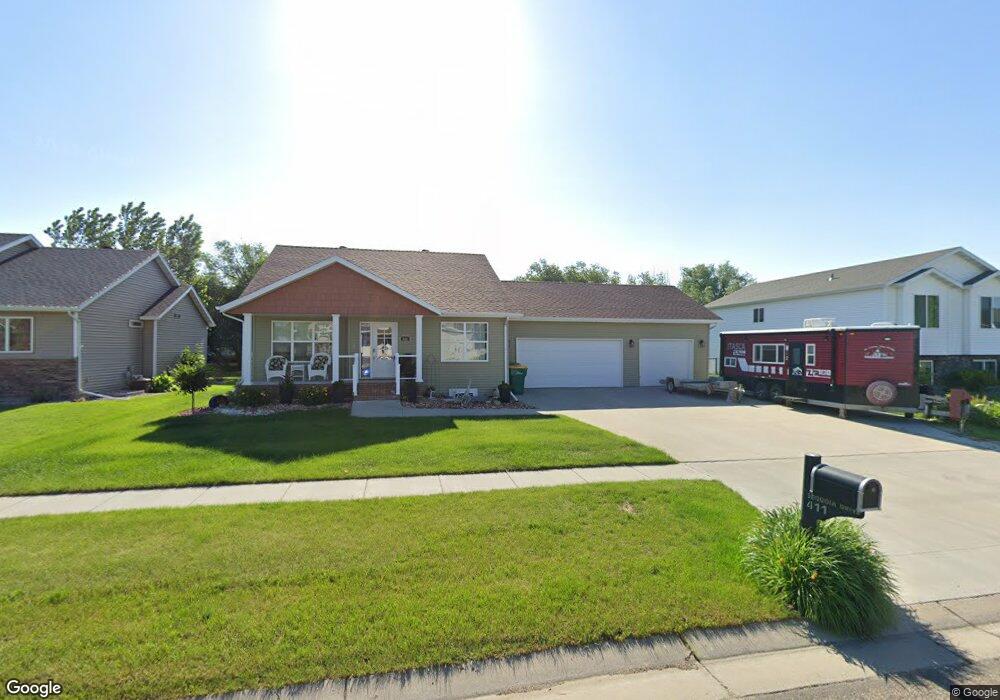
411 Sequoia Dr Mapleton, ND 58059
Estimated Value: $336,000 - $382,000
4
Beds
3
Baths
1,284
Sq Ft
$282/Sq Ft
Est. Value
About This Home
This home is located at 411 Sequoia Dr, Mapleton, ND 58059 and is currently estimated at $361,977, approximately $281 per square foot. 411 Sequoia Dr is a home located in Cass County with nearby schools including Mapleton Elementary School.
Ownership History
Date
Name
Owned For
Owner Type
Purchase Details
Closed on
Jan 15, 2009
Sold by
Heritage Homes Llc
Bought by
Gustafson Brent L and Gustafson Claudette M
Current Estimated Value
Home Financials for this Owner
Home Financials are based on the most recent Mortgage that was taken out on this home.
Original Mortgage
$153,896
Outstanding Balance
$99,079
Interest Rate
5.53%
Mortgage Type
VA
Estimated Equity
$262,898
Purchase Details
Closed on
Sep 22, 2008
Sold by
Gustafson Brent and Gustafson Claudette
Bought by
Heritage Home Llc
Home Financials for this Owner
Home Financials are based on the most recent Mortgage that was taken out on this home.
Original Mortgage
$123,041
Interest Rate
6.41%
Mortgage Type
Credit Line Revolving
Purchase Details
Closed on
Jun 12, 2008
Sold by
Olsen Lee and Olsen Kathryn
Bought by
Gustafson Brent L and Geer Gustafson Claudette M
Create a Home Valuation Report for This Property
The Home Valuation Report is an in-depth analysis detailing your home's value as well as a comparison with similar homes in the area
Purchase History
| Date | Buyer | Sale Price | Title Company |
|---|---|---|---|
| Gustafson Brent L | -- | -- | |
| Heritage Home Llc | -- | -- | |
| Gustafson Brent L | -- | -- |
Source: Public Records
Mortgage History
| Date | Status | Borrower | Loan Amount |
|---|---|---|---|
| Open | Gustafson Brent L | $153,896 | |
| Previous Owner | Heritage Home Llc | $123,041 |
Source: Public Records
Tax History
| Year | Tax Paid | Tax Assessment Tax Assessment Total Assessment is a certain percentage of the fair market value that is determined by local assessors to be the total taxable value of land and additions on the property. | Land | Improvement |
|---|---|---|---|---|
| 2024 | $5,261 | $155,800 | $27,450 | $128,350 |
| 2023 | $5,656 | $154,750 | $27,450 | $127,300 |
| 2022 | $5,021 | $141,150 | $27,450 | $113,700 |
| 2021 | $4,959 | $134,750 | $27,450 | $107,300 |
| 2020 | $4,798 | $131,700 | $27,450 | $104,250 |
| 2019 | $4,768 | $131,700 | $27,450 | $104,250 |
| 2018 | $7,113 | $131,700 | $27,450 | $104,250 |
| 2017 | $6,801 | $121,600 | $18,600 | $103,000 |
| 2016 | $6,301 | $116,900 | $17,800 | $99,100 |
| 2015 | $6,035 | $108,250 | $16,500 | $91,750 |
| 2014 | $4,601 | $98,400 | $15,000 | $83,400 |
| 2013 | $4,500 | $90,800 | $15,000 | $75,800 |
Source: Public Records
Map
Nearby Homes
- 415 Sequoia Dr
- 409 Sequoia Dr
- 378 Carlsbad Ave
- 380 Carlsbad Ave
- 376 Carlsbad Ave
- 417 Sequoia Dr
- 407 Sequoia Dr
- 418 Sequoia Dr
- 382 Carlsbad Ave
- 374 Carlsbad Ave
- 416 Sequoia Dr
- 419 Sequoia Dr
- 405 Sequoia Dr
- 420 Sequoia Dr
- 414 Sequoia Dr
- 384 Carlsbad Ave
- 403 Sequoia Dr
- 412 Sequoia Dr
- 425 Sequoia Dr
- 377 Carlsbad Ave
Your Personal Tour Guide
Ask me questions while you tour the home.