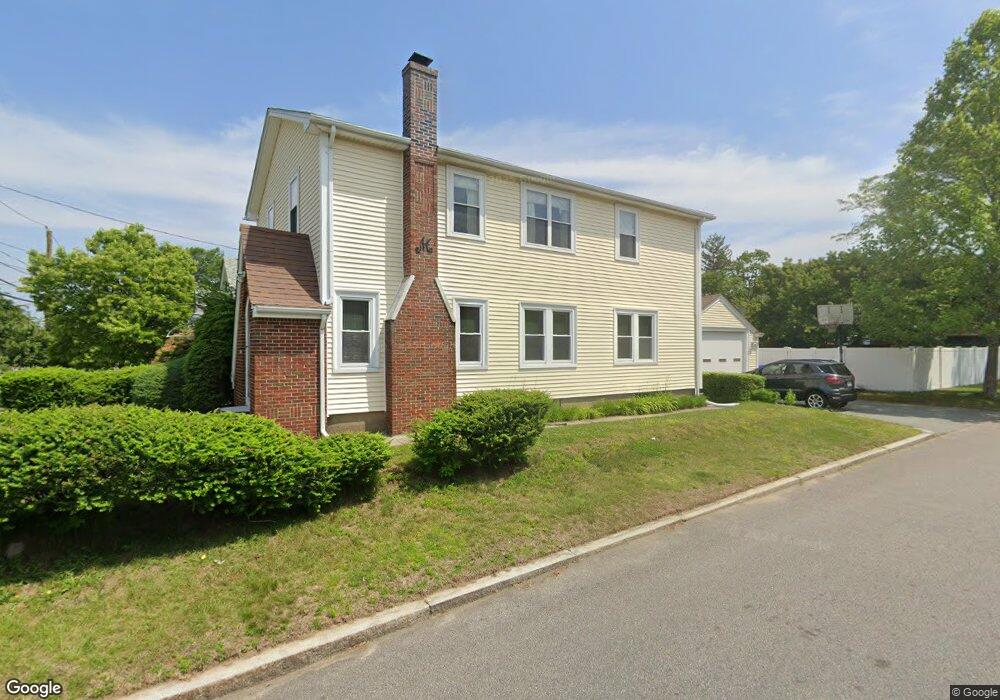
411 Sharon St Providence, RI 02908
Elmhurst NeighborhoodEstimated Value: $419,000 - $585,000
5
Beds
3
Baths
2,220
Sq Ft
$222/Sq Ft
Est. Value
About This Home
This home is located at 411 Sharon St, Providence, RI 02908 and is currently estimated at $491,849, approximately $221 per square foot. 411 Sharon St is a home located in Providence County with nearby schools including Asa Messer Elementary School, Charles N. Fortes Elementary School, and Veazie Street Elementary School.
Ownership History
Date
Name
Owned For
Owner Type
Purchase Details
Closed on
May 30, 2003
Sold by
Mcquade Michael P
Bought by
Dimascio Roberto and Mascio Maria M
Current Estimated Value
Home Financials for this Owner
Home Financials are based on the most recent Mortgage that was taken out on this home.
Original Mortgage
$187,200
Outstanding Balance
$82,478
Interest Rate
5.86%
Estimated Equity
$409,371
Purchase Details
Closed on
Jun 28, 1999
Sold by
Polce Maureen R and Dinofrio Jacqueline A
Bought by
Mcquade Michael P
Home Financials for this Owner
Home Financials are based on the most recent Mortgage that was taken out on this home.
Original Mortgage
$80,250
Interest Rate
7.09%
Create a Home Valuation Report for This Property
The Home Valuation Report is an in-depth analysis detailing your home's value as well as a comparison with similar homes in the area
Home Values in the Area
Average Home Value in this Area
Purchase History
| Date | Buyer | Sale Price | Title Company |
|---|---|---|---|
| Dimascio Roberto | $208,000 | -- | |
| Mcquade Michael P | $84,500 | -- |
Source: Public Records
Mortgage History
| Date | Status | Borrower | Loan Amount |
|---|---|---|---|
| Open | Mcquade Michael P | $38,500 | |
| Open | Mcquade Michael P | $187,200 | |
| Previous Owner | Mcquade Michael P | $81,000 | |
| Previous Owner | Mcquade Michael P | $80,250 |
Source: Public Records
Tax History Compared to Growth
Tax History
| Year | Tax Paid | Tax Assessment Tax Assessment Total Assessment is a certain percentage of the fair market value that is determined by local assessors to be the total taxable value of land and additions on the property. | Land | Improvement |
|---|---|---|---|---|
| 2024 | $6,367 | $347,000 | $103,800 | $243,200 |
| 2023 | $6,367 | $347,000 | $103,800 | $243,200 |
| 2022 | $6,177 | $347,000 | $103,800 | $243,200 |
| 2021 | $6,508 | $265,000 | $79,200 | $185,800 |
| 2020 | $6,508 | $265,000 | $79,200 | $185,800 |
| 2019 | $6,508 | $265,000 | $79,200 | $185,800 |
| 2018 | $6,002 | $187,800 | $63,600 | $124,200 |
| 2017 | $6,002 | $187,800 | $63,600 | $124,200 |
| 2016 | $6,002 | $187,800 | $63,600 | $124,200 |
| 2015 | $5,945 | $179,600 | $63,600 | $116,000 |
| 2014 | $6,062 | $179,600 | $63,600 | $116,000 |
| 2013 | $6,062 | $179,600 | $63,600 | $116,000 |
Source: Public Records
Map
Nearby Homes
- 421 Sharon St
- 409 Sharon St
- 433 Sharon St
- 120 Bradley St
- 407 Sharon St
- 180 Sandringham Ave
- 435 Sharon St
- 418 Sharon St
- 116 Bradley St
- 410 Sharon St
- 176 Sandringham Ave
- 405 Sharon St
- 169 Sandringham Ave
- 426 Sharon St
- 69 Stonelaw Ave
- 406 Sharon St
- 434 Sharon St
- 434 Sharon St Unit 2
- 14 Mink Rd
- 172 Sandringham Ave